. 2000 Feb 1;20(3):908-18.
doi: 10.1523/JNEUROSCI.20-03-00908.2000.

Secondary nicotinic synapses on sympathetic B neurons and their putative role in ganglionic amplification of activity

Affiliations

Secondary nicotinic synapses on sympathetic B neurons and their putative role in ganglionic amplification of activity

P Karila et al. J Neurosci. .

Abstract

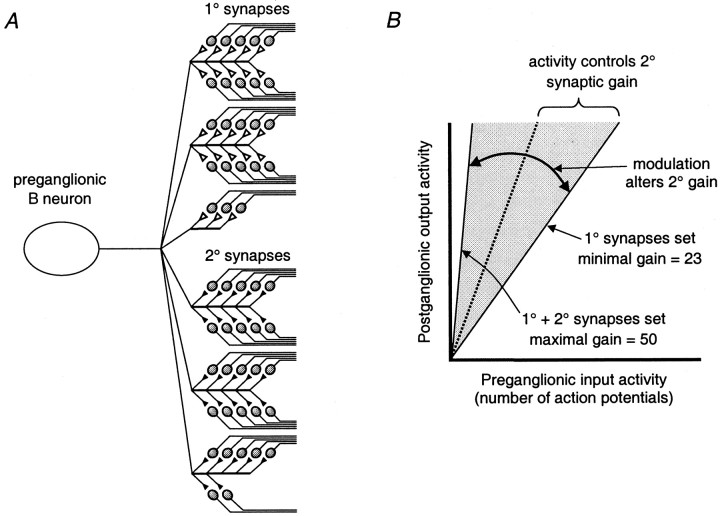
The strength and number of nicotinic synapses that converge on secretomotor B neurons were assessed in the bullfrog by recording intracellularly from isolated preparations of paravertebral sympathetic ganglia 9 and 10. One input to every B neuron invariably produced a suprathreshold EPSP and was defined as the primary nicotinic synapse. In addition, 93% of the cells received one to four subthreshold inputs that were defined as secondary nicotinic synapses. This contradicts the prevailing view, which has long held that amphibian B neurons are singly innervated. More important, the results revealed that B cells provide the simplest possible experimental system for examining the role of secondary nicotinic synapses on sympathetic neurons. Combining the convergence data with previous estimates of divergence indicates that the average preganglionic B neuron forms connections with 50 ganglionic B neurons and that the majority of these nicotinic synapses are secondary in strength. Secondary EPSPs evoked by low-frequency stimulation ranged from 0.5 to 10 mV in amplitude and had an average quantal content of 1. Nonetheless, secondary synapses could trigger action potentials via four mechanisms: spontaneous fluctuations of EPSP amplitude, two-pulse facilitation, coactivation with other secondary synapses, and coactivation with a slow peptidergic EPSP. The data were used to formulate a stochastic theory of integration, which predicts that ganglia function as amplifiers of the sympathetic outflow. In this two-component scheme, primary nicotinic synapses mediate invariant synaptic gain, and secondary nicotinic synapses mediate activity-dependent synaptic gain. The model also provides a common framework for considering how facilitation, metabotropic mechanisms, and preganglionic oscillators regulate synaptic amplification in sympathetic ganglia.


Figures

Fig. 1.
Fig. 1.
Identification of primary and secondary nicotinic EPSPs. A, Schematic for convergence of primary (1°) and secondary (2°) synapses on a sympathetic B neuron is shown.B, Presynaptic stimulation of the primary synapse evoked an invariably suprathreshold EPSP, which distorted the action potential afterhyperpolarization. C, Lowering presynaptic stimulus strength revealed subthreshold secondary EPSPs. Superimposed records illustrate the range of spontaneous fluctuations in EPSP amplitude. In this cell, the secondary EPSP occasionally crossed threshold. Inset, Spike afterpotentials triggered by the secondary synapse showed little sign of an EPSP. Vm = −48 mV.
Fig. 2.
Fig. 2.
Examples of two B neurons with relatively high levels of synaptic convergence. One cell had five synapses (A, B), and the other had four synapses (C, D).A,C, Combined and resolved secondary EPSPs from each cell are depicted. Also shown are action potentials (right) initiated by the primary synapses. Each record is an average of 9–18 responses at 0.2 Hz. Individual components of the combined EPSP each had a distinct stimulus threshold or latency. Components of secondary EPSPs were resolved by subtraction. For example, inputa in A was selectively evoked by stimuli of 0.48–0.53 V, inputsa + b were evoked by 0.55 V stimuli, andinputb was resolved by subtractinga from a + b. B,D, Top,The relation between stimulus intensity and secondary EPSP amplitude illustrates the differences in threshold for individual secondary synapses. D, Bottom, The transmission failure rate decreased as stimulus intensity was increased.
Fig. 3.
Fig. 3.
Impact of resting membrane properties on estimates of convergence and secondary EPSP amplitude. A, B, The number of secondary nicotinic synapses per neuron did not correlate with Vm (A) andRleak (B). C, D, Secondary EPSP amplitude declined with decreases in Vm (C) andRleak (D). Eachpoint [○ (A, C); ■ (B, D)] in the scatter plots represents data from one cell. Lines are drawn by linear regression.
Fig. 4.
Fig. 4.
Analysis of secondary EPSP amplitudes.A, Selected stimulus trials illustrate EPSPs evoked by 0.2 Hz stimulation. In most of the trials shown, each nerve stimulus evoked a short-latency synchronous EPSP and an asynchronous EPSP (*) whose latency was longer and variable. An arrow in the first trial marks a failure of synchronous transmission.B, In an amplitude histogram, the distribution of 154 asynchronous EPSPs recorded from the neuron in A shows a positive skew and an average amplitude (x) of 1.39 ± 0.02 mV. C, The amplitude histogram of synchronous EPSPs evoked from the same neuron (X = 2.67 ± 0.13; 341 trials) was broad and lacked discrete peaks at intervals corresponding to the average amplitude of asynchronous EPSPs. In this histogram, the peak near 0 mV corresponds to 131 transmission failures. D, The distribution of EPSP amplitudes from another B neuron in which synchronous responses (largegraph) and asynchronous responses (Asynch; inset) were recorded. Thethicksolidline in thelargegraph was drawn from a binomial fit in which N = 4 and p = 0.56. In this cell, x = 0.6 ± 0.02 mV (n = 24), and X = 1.4 ± 0.04 mV (n = 240). Thinlines in the histogram were generated by the binomial-fitting procedure, and they represent baseline noise and the expected distribution of EPSP amplitudes attributable to zero to four quantal events. Negative values in the overall fit (thickline) were introduced by the baseline noise.
Fig. 5.
Fig. 5.
Paired-pulse facilitation of secondary EPSPs can enhance firing. A, The time course of facilitation in one neuron, as shown by superimposed records of paired EPSPs, at stimulus intervals of 10, 30, and 80 msec. Eachtrace is an average of 6–10 trials after removing responses that evoked action potentials. B, The time course of facilitation in grouped data. Paired-pulse ratios [(peak of second response)(peak of first response)−1] are plotted as a function of stimulus interval (each pointrepresents 6–17 cells). As in A, facilitation of EPSP amplitude is maximal at an interstimulus interval of 10 msec and decays rapidly at longer intervals. C, Superimposed trials from a neuron in which stimulation at a two-pulse frequency of 12.5 Hz increased the proportion of action potentials generated by the second response of the pair. In this case, Rleak(500 MΩ) was particularly high, suggesting that the recording represents behavior under conditions of minimal impalement damage.D, Cellular variation in the percentage of action potentials generated by the second EPSP at different interstimulus frequencies for four neurons with differentRleak values. Legend:Rleak = 500 MΩ (■), 200 MΩ (▪), 130 MΩ (○), and 14 MΩ (●). The interstimulus frequency is the reciprocal of the paired-pulse interval.
Fig. 6.
Fig. 6.
Summation of two secondary EPSPs can enhance firing. A, Resolved inputs from a neuron with two secondary synapses (top; a, b) and a primary synapse (bottom) are shown. B,Top, Selective stimulation of the lower threshold input (A; a) evoked an EPSP that never reached threshold. Bottom, Coactivation of inputs a + b triggered action potentials in 8 of 24 trials.
Fig. 7.
Fig. 7.
Interaction between secondary EPSPs and the slow peptidergic EPSP can enhance firing. A, Chart record of fast EPSPs before and during a slow EPSP generated by stimulation of the preganglionic C pathway (*). The large fast responses are truncated action potentials. After stimulation of the slow EPSP there was a clear increase in the proportion of secondary EPSPs that triggered action potentials. B, Plot of subthreshold EPSP amplitudes showing a slight reduction in the size of nicotinic responses during the slow EPSP and an apparent increase in the failures of fast transmission.
Fig. 8.
Fig. 8.
Schematic depictions of the preganglionic neural unit (A) and its consequences for ganglionic integration (B). A, The average preganglionic sympathetic B neuron forms 23 primary nicotinic synapses and 27 secondary nicotinic synapses on 50 B neurons in paravertebral ganglia 9 and 10. B, A model depicts the theoretical input–output relation between preganglionic and ganglionic activity. Preganglionic divergence sets the boundaries of synaptic amplification. The lower boundary for ganglionic output is defined by the divergence of primary nicotinic synapses. The upper boundary is set by the sum of primary and secondary divergence. Synaptic gain within these limits is regulated by preganglionic patterns of activity and by mechanisms that enhance or inhibit the strength of secondary nicotinic synapses. The modulatory mechanism can include presynaptic facilitation of transmitter release and effects mediated by the metabotropic actions of neurotransmitters.
Fig. 9.
Fig. 9.
Quantitative predictions based on a stochastic model of synaptic amplification. Calculations were performed for three levels of synaptic convergence. A, Convergence of 1.2 secondary synapses and one primary synapse reflects the average observed in our survey of B neurons. B, Convergence of three secondary synapses and one primary synapse mimics the maximal polyinnervation observed in individual B neurons (e.g., Fig.2C) and may be more characteristic of vasomotor C neurons (Dodd and Horn, 1983b). C, Convergence of nine secondary synapses and one primary synapse approximates the innervation pattern found in the SCG of the rat and guinea pig (Purves et al., 1986). LeftColumn, Graphs plot Equation4, the probability that two secondary EPSPs will coincide to trigger an action potential within a window of summation (tsum; range, 10–100 msec), as a function of the preganglionic firing ratefpre. MiddleColumn, The predicted synaptic transformation of preganglionic firing rates based on Equation 6 and then limited so that secondary synapses never can drive action potentials at rates >10 Hz is illustrated. Dashedlines in the synaptic transforms depict the lower boundary, in the absence of secondary synaptic activity. RightColumn, The cellular synaptic gain relations that were calculated using Equation 7 and the data in the middlecolumn are illustrated. For each set of conditions, synaptic gain is tuned in a nonlinear manner to presynaptic frequencies that lie between 1 and 8 Hz. The tuning shifts to lowerfpre with increases in eithertsum or secondary synaptic convergence (n). Dashedhorizontallines in the three sets of gain relations mark the theoretical upper limit (n + 1) for synaptic amplification at each level of convergence.

Similar articles

Cited by

References

    1. Akasu T, Kojima M, Koketsu K. Luteinizing hormone-releasing hormone modulates nicotinic ACh-receptor sensitivity in amphibian cholinergic transmission. Brain Res. 1983;279:347–351. - PubMed
    1. Allen C, Stevens CF. An evaluation of causes for unreliability of synaptic transmission. Proc Natl Acad Sci USA. 1994;91:10380–10383. - PMC - PubMed
    1. Blackman JG, Ginsborg BL, Ray C. Synaptic transmission in the sympathetic ganglion of the frog. J Physiol (Lond) 1963a;167:355–373. - PMC - PubMed
    1. Blackman JG, Ginsborg BL, Ray C. Spontaneous synaptic activity in sympathetic ganglion cells of the frog. J Physiol (Lond) 1963b;167:389–401. - PMC - PubMed
    1. Clements JD, Bekkers JM. Detection of spontaneous synaptic events with an optimally scaled template. Biophys J. 1997;73:220–229. - PMC - PubMed

Publication types

LinkOut - more resources