. 2000 Feb 1;20(3):937-48.
doi: 10.1523/JNEUROSCI.20-03-00937.2000.

Kinetic differences between synaptic and extrasynaptic GABA(A) receptors in CA1 pyramidal cells

Affiliations

Kinetic differences between synaptic and extrasynaptic GABA(A) receptors in CA1 pyramidal cells

M I Banks et al. J Neurosci. .

Abstract

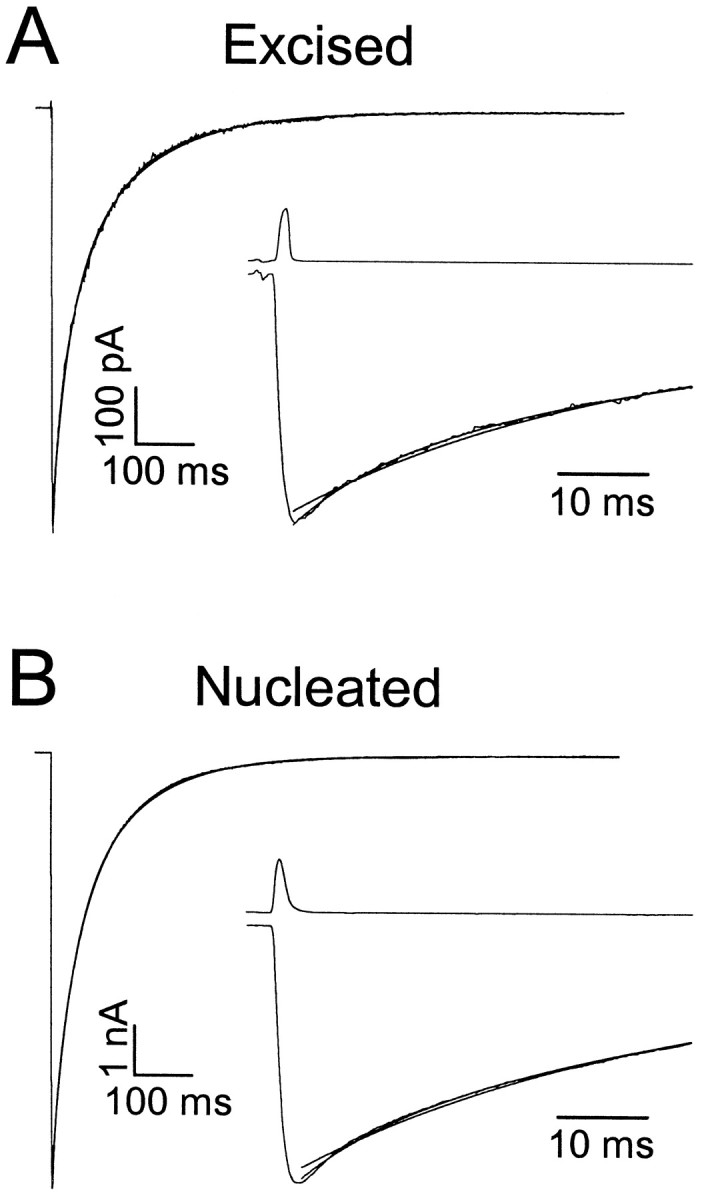
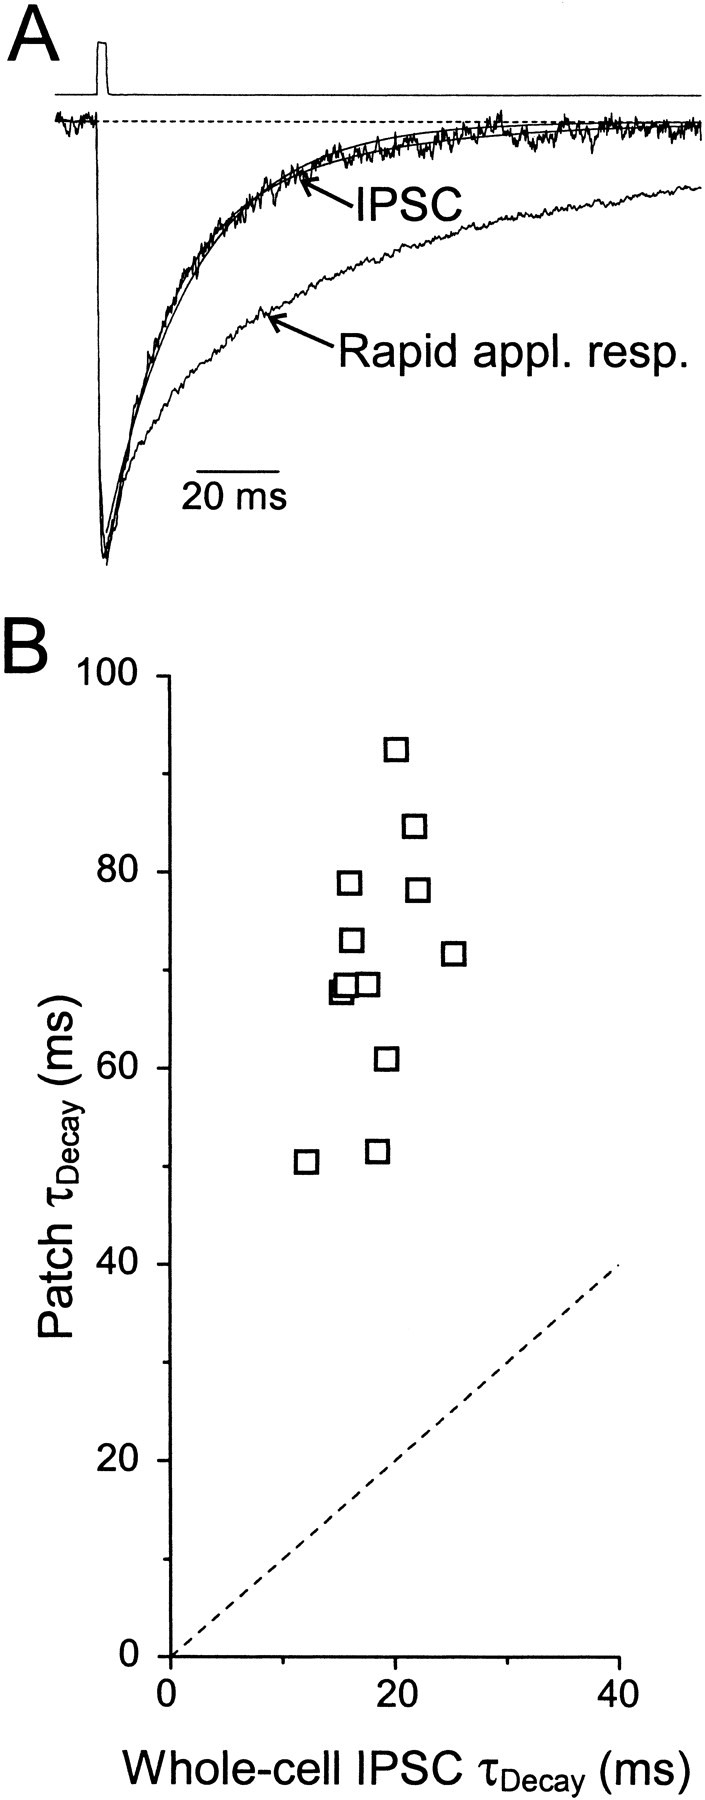
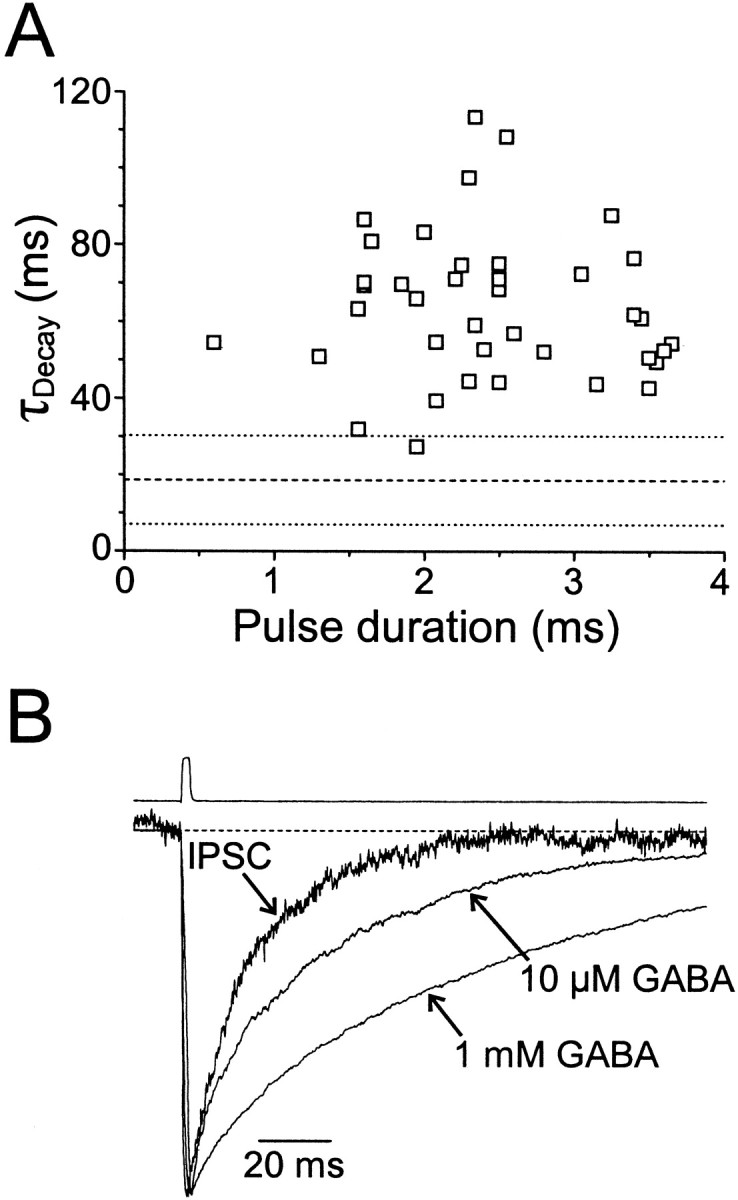
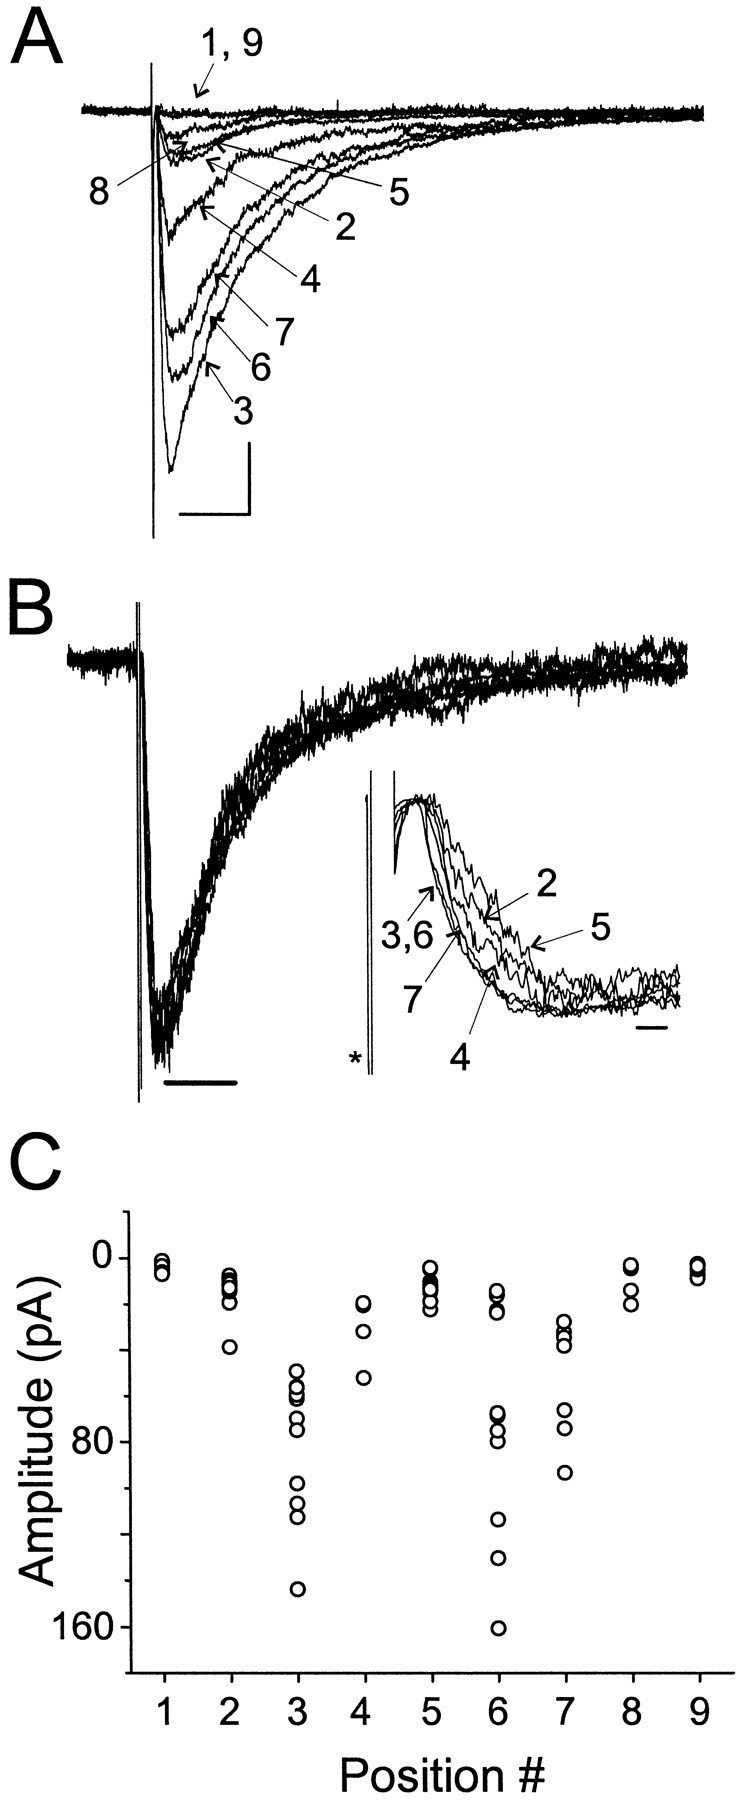
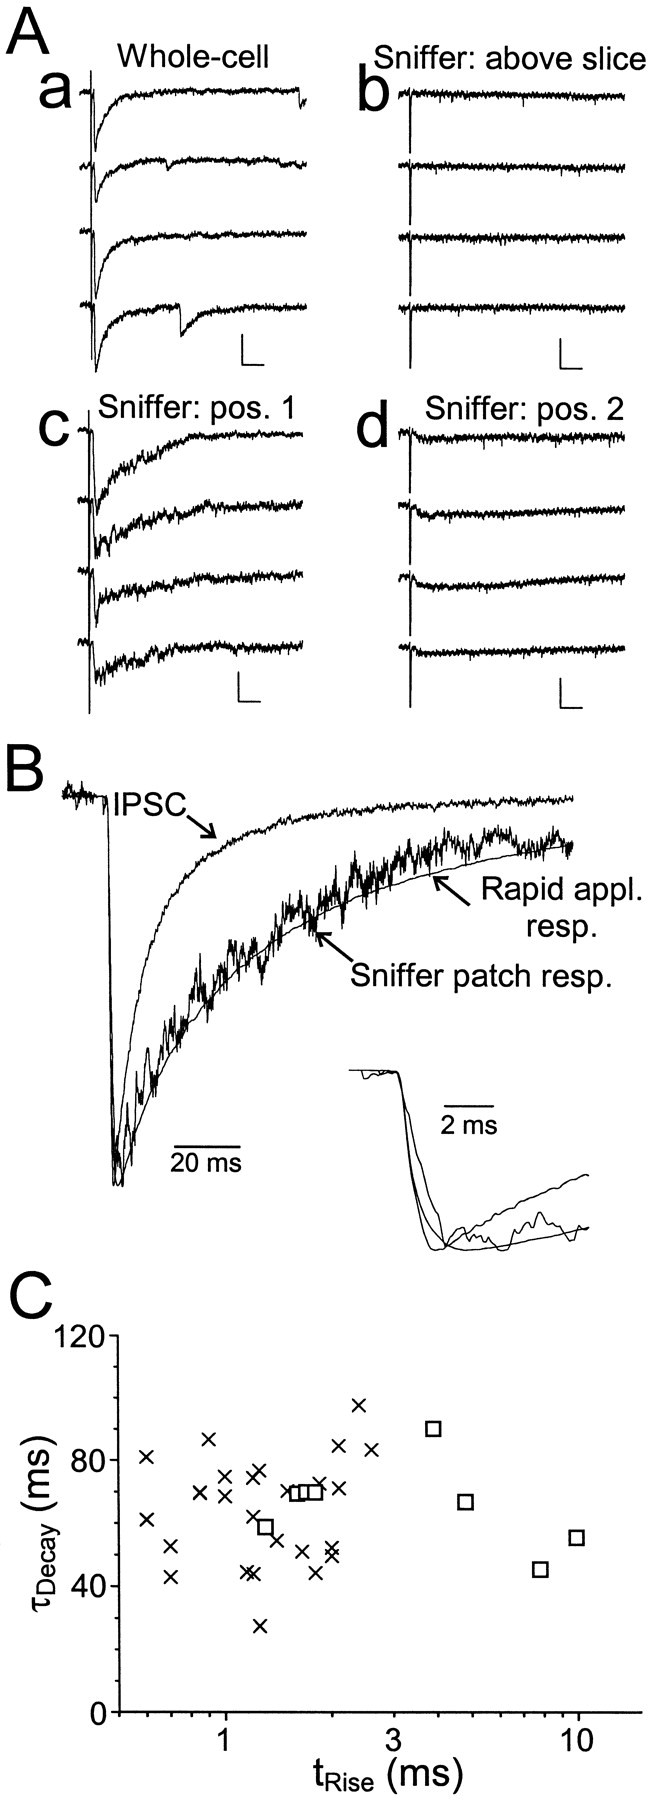
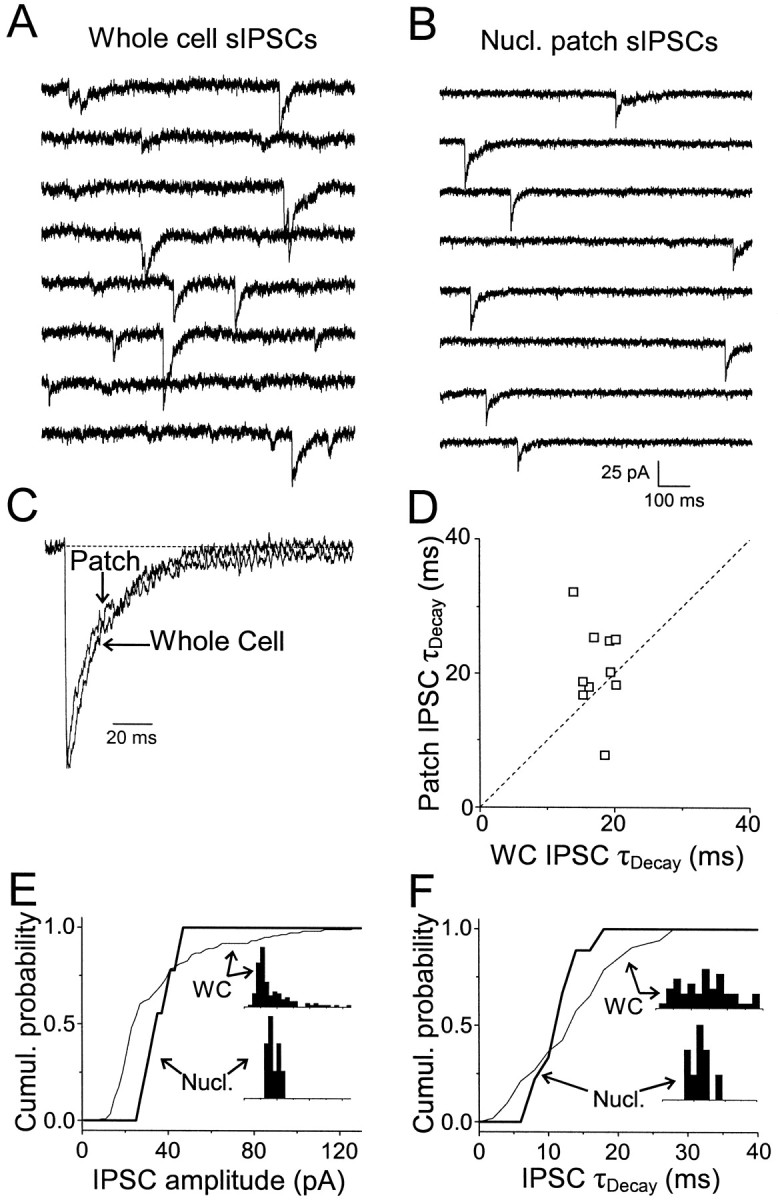
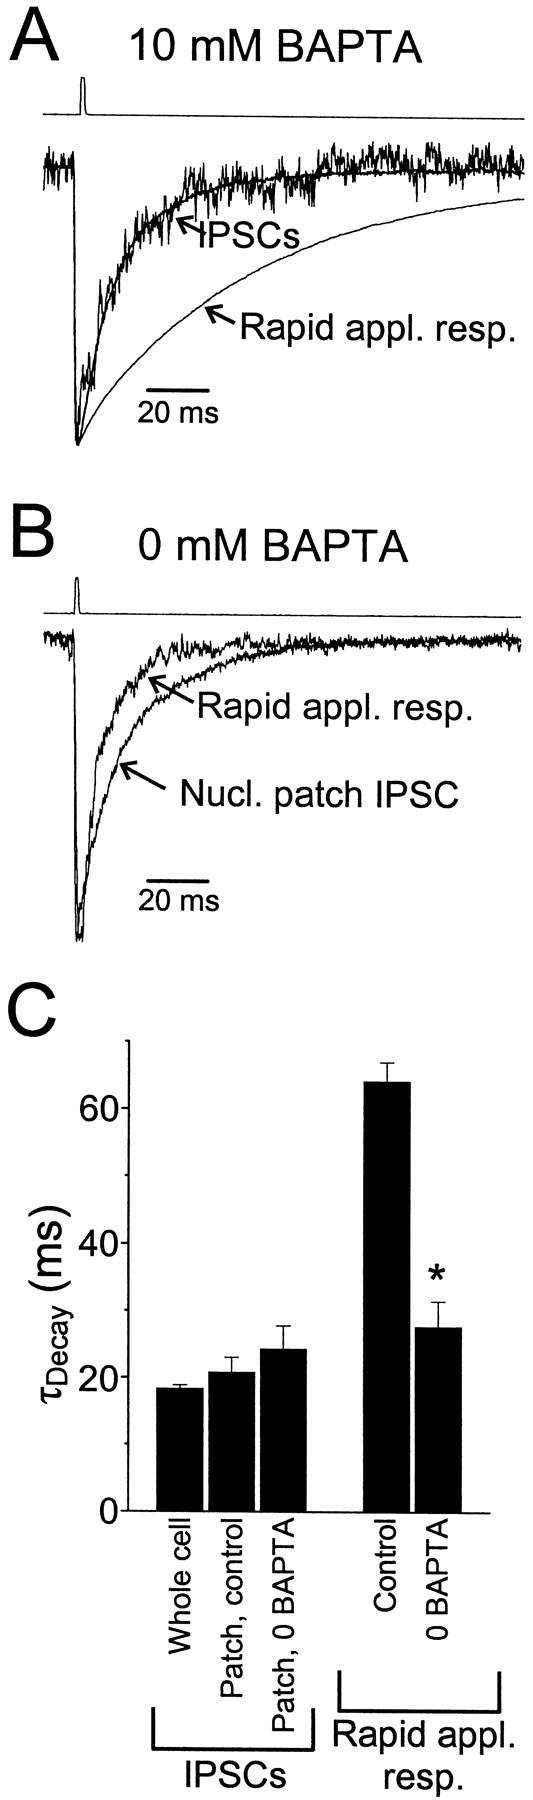
GABA(A)-mediated IPSCs typically decay more rapidly than receptors in excised patches in response to brief pulses of applied GABA. We have investigated the source of this discrepancy in CA1 pyramidal neurons. IPSCs in these cells decayed rapidly, with a weighted time constant tau(Decay) of approximately 18 msec (24 degrees C), whereas excised and nucleated patch responses to brief pulses of GABA (2 msec, 1 mM) decayed more than three times as slowly (tau(Decay), approximately 63 msec). This discrepancy was not caused by differences between synaptic and exogenous transmitter transients because (1) there was no dependence of tau(Decay) on pulse duration for pulses of 0.6-4 msec, (2) responses to GABA at concentrations as low as 10 microM were still slower to decay (tau(Decay), approximately 41 msec) than IPSCs, and (3) responses of excised patches to synaptically released GABA had decay times similar to brief pulse responses. These data indicate that the receptors mediating synaptic versus brief pulse responses have different intrinsic properties. However, synaptic receptors were not altered by the patch excision process, because fast, spontaneous IPSCs could still be recorded in nucleated patches. Elevated calcium selectively modulated patch responses to GABA pulses, with no effect on IPSCs recorded in nucleated patches, demonstrating the presence of two receptor populations that are differentially regulated by intracellular second messengers. We conclude that two receptor populations with distinct kinetics coexist in CA1 pyramidal cells: slow extrasynaptic receptors that dominate the responses of excised patches to exogenous GABA applications and fast synaptic receptors that generate rapid IPSCs.


Figures

Fig. 1.
Fig. 1.
Kinetics of excised and nucleated patch responses.A, Averaged responses to brief exogenous pulses of GABA (2.0 msec, 1 mm) recorded in an excised outside-out patch taken from the soma of a CA1 pyramidal cell. Top traceshows the open-tip junction current recorded immediately after terminating the recording. Inset shows data plotted on an expanded time scale, to illustrate superior fit obtained with three versus two exponential components. Biexponential fit parameters were τDec1,2 = 29.4 (50%) and 129.8 msec. Triexponential fit parameters were τDec1,2,3 = 10.4 (23%), 61.7 (52%), and 173.3 msec. B, Same as A, but for a nucleated patch obtained from a different cell. Note difference in vertical calibration. Biexponential fit parameters were τDec1,2 = 32.9 (50%) and 112.7 msec. Triexponential fit parameters were τDec1,2,3 = 9.88 (17%), 56.7 (59%), and 145.2 msec.
Fig. 2.
Fig. 2.
IPSCs and patch responses have different decay kinetics. A, Normalized average spontaneous IPSC and rapid application response to 1 mm GABA in an excised patch recorded from the same cell before and after patch excision. For the IPSC, biexponential fit parameters were τDec1,2 = 13.1 (68%) and 41.4 msec; monoexponential fit parameter was τDec = 22.0 msec. For the patch response, triexponential fit parameters were τDec1,2,3 = 11.6 (30%), 69.3 (55%), and 244 msec. Top trace shows the open-tip junction current recorded immediately after terminating the recording. B, Decay kinetics of rapid application responses plotted versus decay kinetics of IPSCs recorded in the same cells before patch formation. Dotted line has unity slope. In these 12 cells, fit parameters for the whole-cell IPSCs were τDec1,2 = 11.7 ± 1 (63 ± 1%) and 31.6 ± 2.6 msec. Fit parameters for the rapid application responses were τDec1,2,3 = 9.7 ± 1.6 (16 ± 3%), 54.9 ± 2.8 (63 ± 4%), and 168 ± 11 msec.
Fig. 3.
Fig. 3.
Effect of transmitter duration and concentration on decay kinetics. A, Decay time constants of rapid application responses of excised patches versus the duration of the GABA pulses (1 mm). Dashed and dotted lines represent the mean ± 2 SD τDecay for whole-cell IPSCs. B, Normalized average spontaneous IPSC and rapid application response to 10 μm and 1 mm GABA recorded from the same cell before and after formation of a nucleated patch. For the IPSC, τDec1,2 = 13.4 (74%) and 39.4 msec. For the 10 μm patch response, τDec1,2,3 = 4.67 (20%), 34.7 (61%), and 115 msec. For the 1 mm patch response, τDec1,2,3 = 9.8 (12%), 66.1 (57%), and 173 msec. Top trace shows the open-tip junction current recorded immediately after terminating the recording.
Fig. 4.
Fig. 4.
Responses of excised sniffer patches to synaptically released transmitter. A, Sniffer patch responses to stimuli in stratum pyramidale. Shown are the averaged responses at nine different positions, indicated bynumbers, above and in the slice. Positions 1 and 9 were above the slice. Positions 3 and 6 were the same location and yielded the largest amplitude responses. Position 2 was 10 μm from 3, whereas positions 4, 5, 7, and 8 were 3, 6, 10, and 20 μm from position 3, respectively, in the opposite direction as position 2. Calibration: 15 pA, 20 msec. B, Normalized data from A. Note that the decay kinetics exhibit little dependence on position. Calibration: 50 msec. Inset shows the normalized traces. Note the change in latency and rise time as position was changed.Asterisk marks the stimulus artifact. Trace from position 8 had a high noise level and is not shown. Calibration: 2 msec. C, Peak amplitude as a function of position for individual responses from the positions shown in A andB. Note that although the response amplitudes were variable, there were abrupt changes in the amplitude range as a function of position.
Fig. 5.
Fig. 5.
Comparison of sniffer patch and whole-cell synaptic responses. A, Raw traces recorded in response to stimuli applied to stratum pyramidale. a, Whole-cell IPSCs. b, Sniffer patch data recorded from an excised patch placed above the slice. Note that in this position, no response was evoked by the stratum pyramidale stimulus. c,Response of the same patch to the same stimulus, but recorded after placing the recording electrode tip on a pyramidal cell body.d, Response to the same stimulus after moving the recording electrode ∼5 μm away from the cell body. Distance was gauged using the tip diameter of the patch pipette, which was typically 2–3 μm. Calibration bars: a, 100 pA, 20 msec;b, 25 pA, 20 msec. B, Normalized averaged traces from the data shown in Aa and Ac.Inset shows the same data on an expanded time scale. For the IPSC, tRise = 0.7 msec, τDecay = 16.0 msec. For the sniffer patch response, tRise = 1.7 msec, τDecay = 69.9 msec. Also shown is the averaged rapid application response from all excised patches. C,Weighted decay time constant versus rise time plotted for eight sniffer patch responses (squares) and for excised patch responses (crosses). Note that there is no correlation between rise time and decay time for the sniffer patch data. Note also that the responses from four of the sniffer patches fall within the range of rise times recorded from excised patches.
Fig. 6.
Fig. 6.
Properties of spontaneous IPSCs recorded in nucleated patches. A, Whole-cell sIPSCs recorded before patch excision. Traces are consecutive. This cell corresponds to cell 1 in Table 2. B, sIPSCs recorded from a nucleated patch after removal from the slice. Traces are not consecutive and represent all of the spontaneous events recorded over an 80 sec period.C, Normalized averaged sIPSCs from the cell inA and B. Biexponential fits were: whole-cell, τDec1,2 = 9.9 (47%) and 27.8 msec; patch, τDec1,2 = 6.1 (47%) and 32.8 msec.D, Patch IPSC weighted time constant versus whole-cell IPSC weighted time constant for 10 cells. There was no significant difference in mean τDecay between the patch and whole-cell data (p = 0.2, paired Student'st test). E, Cumulative amplitude distribution for spontaneous IPSCs recorded in the same cell as inA-C in whole-cell (thin line) and nucleated patch (thick line). Inset shows normalized amplitude distributions. F, Same as E, but for τDecay.
Fig. 7.
Fig. 7.
Selective modulation of rapid application responses by elevated calcium. A, Normalized whole-cell (smooth trace) and nucleated patch (noisy trace) sIPSCs and rapid application response of the nucleated patch to 1 mm, 2 msec pulse of GABA recorded with a pipette containing 10 mm BAPTA. All data were recorded from the same cell. τDecay values were as follows: whole-cell IPSC, 16.8 msec; patch IPSC, 15.3 msec; rapid application response, 67.8 msec. B, Normalized nucleated patch IPSC and response in the same patch to a 1 mm, 2 msec GABA pulse recorded in a different patch from A with a pipette containing 0 BAPTA. Note that in 0 BAPTA, the rapid application response is faster than in control, but the IPSC decay is similar. τDecay values were as follows: patch IPSC, 18.6 msec; rapid application response, 7.7 msec. C, Average weighted time constants of whole-cell and patch sIPSCs under control conditions and with 0 BAPTA, and rapid application responses to 1 mm, 2 msec GABA pulses under control conditions and with 0 BAPTA. There was no significant difference between τDecayfor the patch IPSC data (10 mm BAPTA vs 0 BAPTA:p > 0.4, Student's t test), but rapid application responses were significantly faster in the absence of BAPTA (*p < 10−6, Student'st test).

References

    1. Assaf SY, Chung SH. Release of endogenous Zn 2+ from brain tissue during activity. Nature. 1984;308:734–736. - PubMed
    1. Banks MI, Pearce RA. Dual actions of volatile anesthetics on GABAA IPSCs: dissociation of blocking and prolonging effects. Anesthesiology. 1999;90:120–134. - PubMed
    1. Banks MI, Li T-B, Pearce RA. Effects of isoflurane on mIPSCs and excised neuronal GABAA receptors. Soc Neurosci Abstr. 1997;23:104.
    1. Banks MI, Li T-B, Pearce RA. The synaptic basis of GABAA,slow. J Neurosci. 1998;18:1305–1317. - PMC - PubMed
    1. Belelli D, Lambert JJ, Peters JA, Wafford K, Whiting PJ. The interaction of the general anesthetic etomidate with the gamma-aminobutyric acid type A receptor is influenced by a single amino acid. Proc Natl Acad Sci USA. 1997;94:11031–11036. - PMC - PubMed

Publication types

LinkOut - more resources