DNA binding mode of the Fab fragment of a monoclonal antibody specific for cyclobutane pyrimidine dimer
- PMID: 10648787
- PMCID: PMC102577
- DOI: 10.1093/nar/28.4.944
DNA binding mode of the Fab fragment of a monoclonal antibody specific for cyclobutane pyrimidine dimer
Abstract
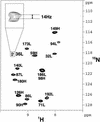
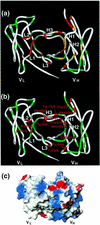
Monoclonal antibodies specific for the cyclobutane pyrimidine dimer (CPD) are widely used for detection and quantification of DNA photolesions. However, the mechanisms of antigen binding by anti-CPD antibodies are little understood. Here we report NMR analyses of antigen recognition by TDM-2, which is a mouse monoclonal antibody specific for the cis - syn -cyclobutane thymine dimer (T[ c, s ]T). (31)P NMR and surface plasmon resonance data indicated that the epitope recognized by TDM-2 comprises hexadeoxynucleotides centered on the CPD. Chemical shift perturbations observed for TDM-2 Fab upon binding to d(T[ c, s ]T) and d(TAT[ c, s ]TAT) were examined in order to identify the binding sites for these antigen analogs. It was revealed that d(T[ c, s ]T) binds to the central part of the antibody-combining site, while the CPD-flanking nucleotides bind to the positively charged area of the V(H)domain via electrostatic interactions. By applying a novel NMR method utilizing a pair of spin-labeled DNA analogs, the orientation of DNA with respect to the antigen-binding site was determined: CPD-containing oligonucleotides bind to TDM-2 in a crooked form, draping the 3'-side of the nucleotides onto the H1 and H3 segments, with the 5'-side on the H2 and L3 segments. These data provide valuable information for antibody engineering of TDM-2.
Figures


Similar articles
-
Antigen structural requirements for recognition by a cyclobutane thymine dimer-specific monoclonal antibody.Nucleic Acids Res. 1997 Oct 1;25(19):3889-94. doi: 10.1093/nar/25.19.3889. Nucleic Acids Res. 1997. PMID: 9380513 Free PMC article.
-
Preliminary studies for interaction of a cyclobutane thymine dimer region with its cognate antibody.Nucleic Acids Symp Ser. 1997;(37):281-2. Nucleic Acids Symp Ser. 1997. PMID: 9586109
-
Simultaneous establishment of monoclonal antibodies specific for either cyclobutane pyrimidine dimer or (6-4)photoproduct from the same mouse immunized with ultraviolet-irradiated DNA.Photochem Photobiol. 1991 Aug;54(2):225-32. doi: 10.1111/j.1751-1097.1991.tb02010.x. Photochem Photobiol. 1991. PMID: 1780359
-
Fab'-induced folding of antigenic N-terminal peptides from intrinsically disordered HIV-1 Tat revealed by X-ray crystallography.J Mol Biol. 2011 Jan 7;405(1):33-42. doi: 10.1016/j.jmb.2010.10.033. Epub 2010 Oct 28. J Mol Biol. 2011. PMID: 21035463 Review.
-
Application of surface plasmon resonance toward studies of low-molecular-weight antigen-antibody binding interactions.Methods. 2000 Mar;20(3):319-28. doi: 10.1006/meth.1999.0925. Methods. 2000. PMID: 10694454 Review.
Cited by
-
Paramagnetic NMR probes for characterization of the dynamic conformations and interactions of oligosaccharides.Glycoconj J. 2015 Oct;32(7):505-13. doi: 10.1007/s10719-015-9599-1. Epub 2015 Jun 7. Glycoconj J. 2015. PMID: 26050258 Review.
-
Cyclization of Single-Chain Fv Antibodies Markedly Suppressed Their Characteristic Aggregation Mediated by Inter-Chain VH-VL Interactions.Molecules. 2019 Jul 18;24(14):2620. doi: 10.3390/molecules24142620. Molecules. 2019. PMID: 31323851 Free PMC article.
References
-
- Setlow R.B. (1978) Nature, 271, 713–717. - PubMed
-
- Suzuki F., Han,A., Lankas,G.R., Utsumi,H. and Elkind,M.M. (1981) Cancer Res., 41, 4916–4924. - PubMed
-
- Friedberg E.C., Walker,G.C. and Siede,W. (1995) DNA Repair and Mutagenesis. ASM Press, Washington, DC.
-
- Roza L., van der Wulp,K.J.M., MacFarlane,S.J., Lohman,P.H.M. and Baan,R.A. (1988) Photochem. Photobiol., 48, 627–633. - PubMed
Publication types
MeSH terms
Substances
LinkOut - more resources
Full Text Sources
Miscellaneous

