. 2000 Jan 28;287(5453):658-61.
doi: 10.1126/science.287.5453.658.

Voltage- and tension-dependent lipid mobility in the outer hair cell plasma membrane

Affiliations

Voltage- and tension-dependent lipid mobility in the outer hair cell plasma membrane

J S Oghalai et al. Science. .

Abstract

The mechanism responsible for electromotility of outer hair cells in the ear is unknown but is thought to reside within the plasma membrane. Lipid lateral diffusion in the outer hair cell plasma membrane is a sigmoidal function of transmembrane potential and bathing media osmolality. Cell depolarization or hyposmotic challenge shorten the cell and reduce membrane fluidity by half. Changing the membrane tension with amphipathic drugs results in similar reductions. These dynamic changes in membrane fluidity represent the modulation of membrane tension by lipid-protein interactions. The voltage dependence may be associated with the force-generating motors that contribute to the exquisite sensitivity of mammalian hearing.


Figures
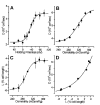
Fig. 1
Fig. 1. Lateral diffusion in the OHC lateral wall plasma membrane
Each point is the average of at least five different measurements, each from a different cell. The error bars represent the SEM. (A) D was measured at holding potentials ranging from +40 to −100 mV (total of 70 measurements from 41 cells). The error bar for the point at 40 mV is smaller than the symbol size. The Boltzmann fit values are: Ddepolarized = 2.18 × 10⁻⁹ cm2/s, Dhyperpolarized = 4.44 × 10⁻⁹ cm2/s, V1/2 = −36 mV, s = 12 mV (23).(B) D was measured while the osmolality of the extracellular solution was varied between 245 and 365 mOsm/kg (total of 275 cells, one measurement per cell). The error bar for the point at 300 mOsm/kg is smaller than the symbol size. The Boltzmann fit values are: Dhypotonic = 3.70 × 10⁻⁹ cm2/s, Dhypertonic = 6.34 × 10⁻⁹ cm2/s, Osm1/2 (the osmolality at the midpoint of the change in D) = 316 mOsm/kg, s = 20 mOsm/kg. The slightly higher D values in these cells compared with those in (A) may be related to differences in intracellular pressure associated with the patch-clamp technique (17).(C) The percent change in cell length (L) was measured while the osmolality of the extracellular solution was varied. This was normalized to their length at 300 mOsm/kg (total of 154 measurements from 77 cells). The Boltzmann fit values are: Lhypotonic = −5.79%, Lhypertonic = 3.51%, Osm1/2 = 294 mOsm/kg, s = 13 mOsm/kg.(D) D was plotted versus L [with the same data as (B) and (C)]. The relation was fit with an exponential function, D = D0 + Aexp(RL), with fit values D0 = 3.43 × 10⁻⁹ cm2/s, A = 1.21 × 10⁻⁹ cm2/s, R = 0.21.
Fig. 2
Fig. 2. The effects of curvature-altering drugs on cell morphology and lateral diffusion
The RBCs serve as a bioassay for the curvature-altering drugs. (A) RBCs were biconcave in the control solution, (B) crenulated in salicylate alone, (C) biconcave in a solution of salicylate and chlorpromazine combined, (D) cupped in chlorpromazine alone, and (E) biconcave after wash-out with control solution. During this 5-min sequential drug application, the length, width, and morphologic appearance of the OHC did not change appreciably. (F) The D value of the OHC lateral wall plasma membrane was reduced from controls (cntl) in the presence of either salicylate alone (sal) or chlorpromazine alone (cpz). It was unchanged in the presence of salicylate and chlorpromazine combined (both) (P = 0.38). The values in parentheses indicate the number of cells averaged together for each measurement and the error bars represent the SEM; a significant difference from control is indicated by an asterisk (P < 0.01, Student’s nonpaired t-test). The D values were as follows (mean ± SEM): cntl, 5.46 × 10⁻⁹ ± 0.44 × 10⁻⁹ cm2/s; sal, 2.58 × 10⁻⁹ ± 0.25 × 10⁻⁹ cm2/s; cpz, 3.64 × 10⁻⁹ ± 0.32 × 10⁻⁹ cm2/s; both, 4.83 × 10⁻⁹ ± 0.41 × 10⁻⁹ cm2/s.
Fig. 3
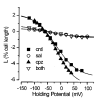
Fig. 3. The effects of curvature-altering drugs on OHC electromotility
The percent change in cell length(L)was measured as the holding potential was varied, normalized to cell length at −60 mV. The control cell (cntl) demonstrated the normal electromotile response. The presence of chlorpromazine alone (cpz) did not suppress electromotility. Salicylate alone (sal) blunted the electromotile response. Chlorpromazine failed to restore electromotility in the presence of salicylate (both). Each curve was obtained from a different cell. The Boltzmann fit values are: cntl, Lhyperpolarized = 2.25%, Ldepolarized = −5.64%, V1/2 = −19 mV, s = 42 mV; sal, Lhyperpolarized = 0.39%, Ldepolarized = −0.65%, V1/2 = −35 mV, s = 41 mV; cpz, Lhyperpolarized = 2.10%, Ldepolarized = −6.73%, V1/2 = −17 mV, s = 37 mV; both, Lhyperpolarized = 0.91%, Ldepolarized = −0.81%, V1/2 = −58 mV, s = 59 mV.
Fig. 4
Fig. 4. Hypothetical nanoscale membrane rippling within the lateral wall of the OHC
The plasma membrane is tethered to a subplasmalemmal cytoskeleton by 30-nm-long “pillars” (p) (24). The molecular composition of the pillars is unknown. The pillars bond to parallel actin filaments (a) that run circumferentially around the cell. The actin filaments are spaced about 40 nm apart and cross-linked with molecules of spectrin (s) that run longitudinally along the cell. (A and C) The OHC when hyperpolarized and depolarized, respectively. Depolarization makes the OHC shorter and wider. (B and D) Potential alterations in membrane curvature resulting from electromotile length changes. Note the increased membrane crenulations in (D).

Similar articles

Cited by

References

    1. Brownell WE, Bader CR, Bertrand D, de Ribaupierre Y. Science. 1985;227:194. - PubMed
    1. Dallos P. J Neurosci. 1992;12:4575. - PMC - PubMed
    2. Oghalai JS, et al. J Neurophysiol. 1998;79:2235. - PubMed
    3. Zhao HB, Santos-Sacchi J. Nature. 1999;399:359. - PubMed
    1. Vaz WLC, Derzko ZI, Jacobson KA. In: Membrane Reconstitution. Poste G, Nicolson GL, editors. Elsevier; Amsterdam: 1982. pp. 83–136.
    1. Golan DE, Alecio MR, Veatch WR, Rando RR. Biochemistry. 1984;23:332. - PubMed
    1. The organ of Corti was isolated from the cochleae of guinea pigs, incubated for 3 to 5 min with trypsin, and dissociated onto a microwell petri dish. For some experiments, rat hippocampal neurons were used as a control. These cells were harvested on embryonic day 19 and grown in culture for 9 to 12 days in serum-free medium. Dissection and experiments were performed at 22°C in an extracellular solution consisting of the following: 155 mM NaCl, 4 mM KCl, 1 mM MgCl2, 2 mM CaCl2, 10 mM Hepes, and 10 mM glucose. The solution was adjusted to a pH of 7.3 and an osmolality of 320 mOsm/kg. We stained the plasma membrane of the isolated cells with di-8-ANEPPS, a fluorescent molecule with a short hydrophobic tail that inserts itself into the outer leaflet of the phospholipid bilayer. Di-8-ANEPPS (75 μM) was dispersed into extracellular solution by sonication for 1 min, and the cells were stained for 5 min before unbound dye was thoroughly rinsed away with extracellular solution alone Montana V, Farkas DL, Loew LM. Biochemistry. 1989;28:4536.Oghalai JS, Tran TD, Raphael RM, Nakagawa T, Brownell WE. Hear Res. 1999;135:19.

Publication types

MeSH terms