. 2000 Feb 8;39(5):1067-75.
doi: 10.1021/bi991810u.

Charged membrane surfaces impede the protein-mediated transfer of glycosphingolipids between phospholipid bilayers

Affiliations

Charged membrane surfaces impede the protein-mediated transfer of glycosphingolipids between phospholipid bilayers

P Mattjus et al. Biochemistry. .

Abstract

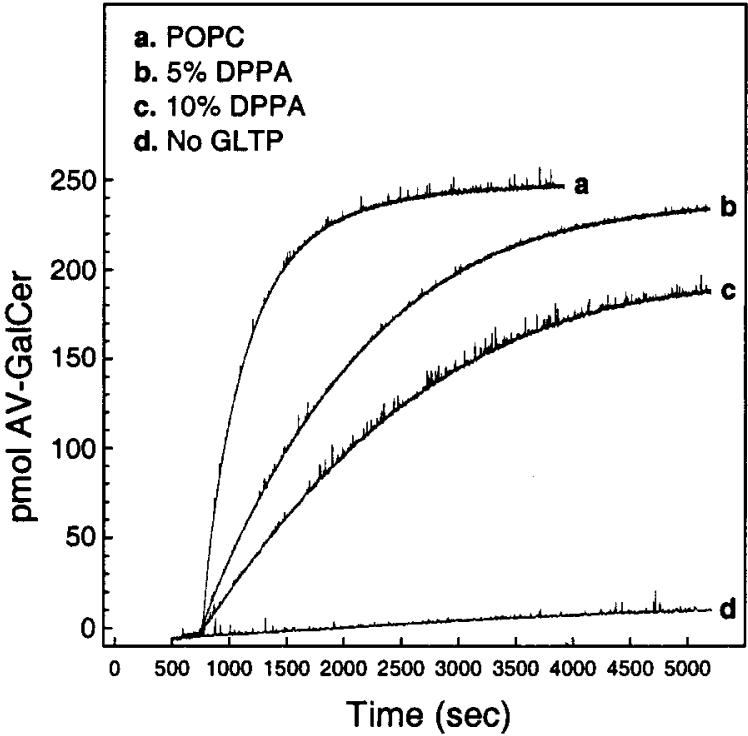
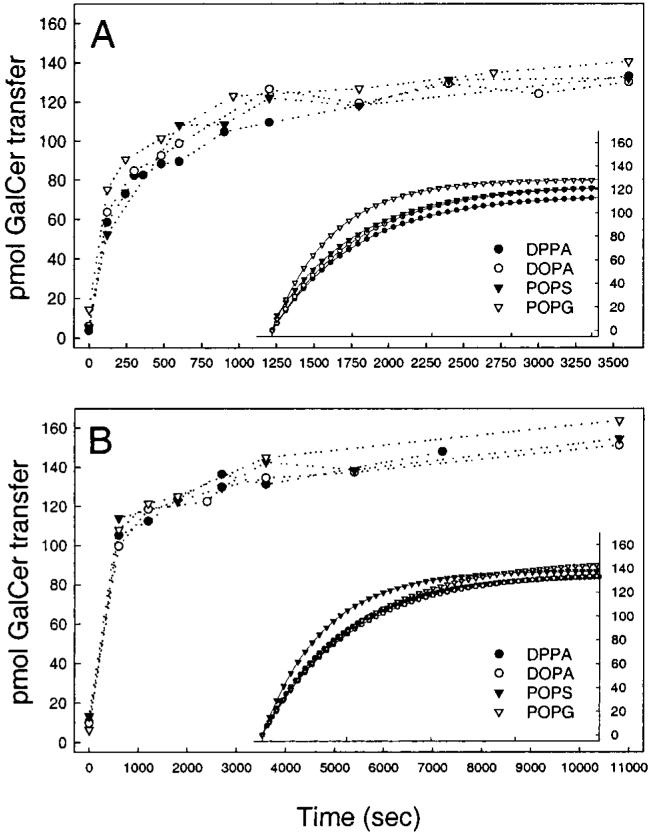
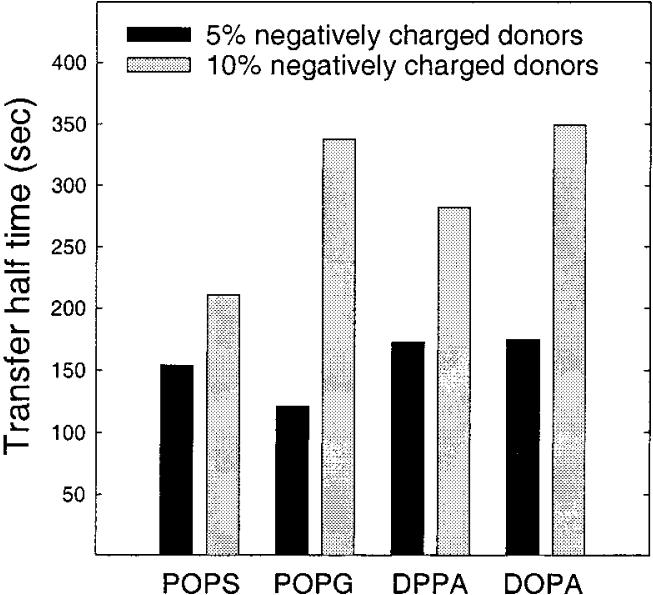
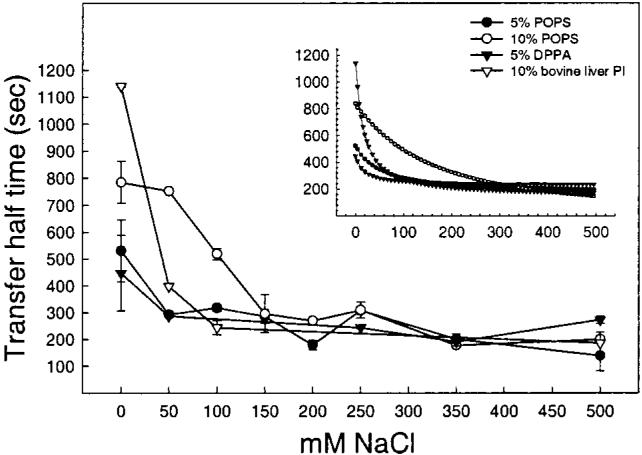
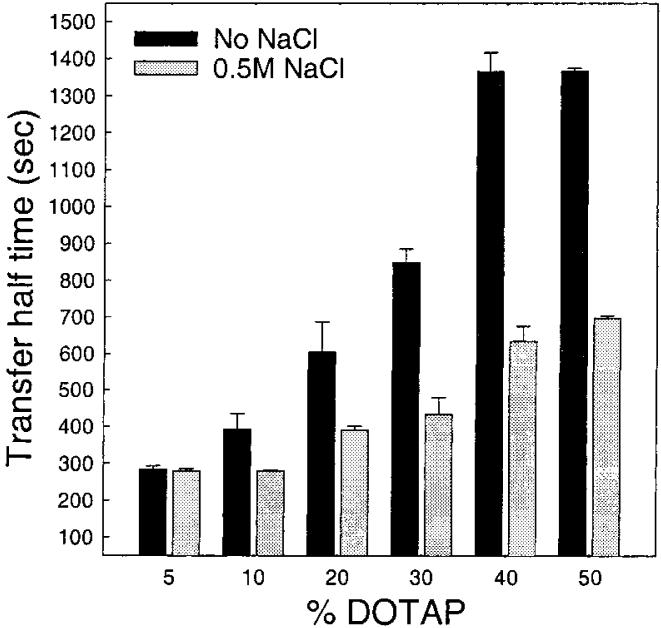
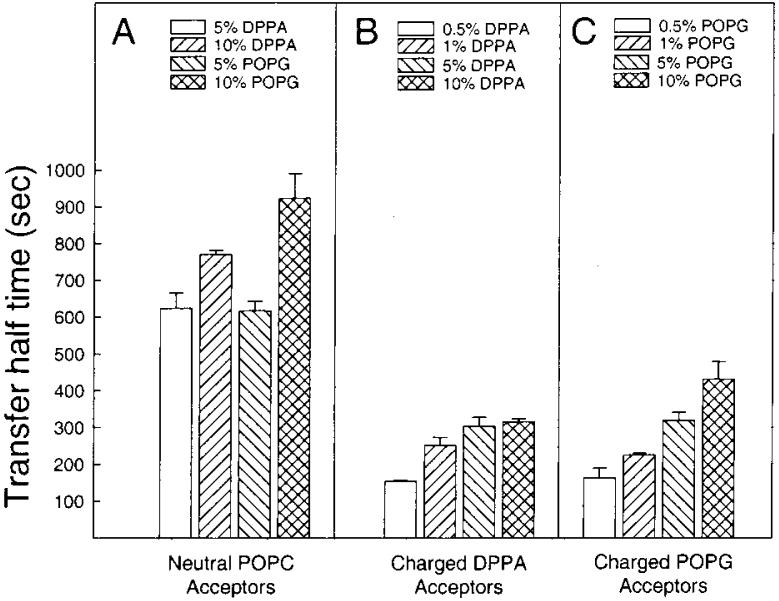
A lipid transfer protein that facilitates the transfer of glycolipids between donor and acceptor membranes has been investigated using a fluorescence resonance energy transfer assay. The glycolipid transfer protein (23-24 kDa, pI 9.0) catalyzes the high specificity transfer of lipids that have sugars beta-linked to either a ceramide or a diacylglycerol backbone, such as simple glycolipids and gangliosides, but not the transfer of phospholipids, cholesterol, or cholesterol esters. In this study, we examined the effect of different charged lipids on the rate of transfer of anthrylvinyl-labeled galactosylceramide (1 mol %) from a donor to acceptor vesicle population at neutral pH. Compared to neutral donor vesicle membranes, introduction of negatively charged lipid at 5 or 10 mol % into the donor vesicles significantly decreased the transfer rate. Introduction of the same amount of negative charge into the acceptor vesicle membrane did not impede the transfer rate as effectively. Also, positive charge in the donor vesicle membrane was not as effective at slowing the transfer rate as was negative charge in the donor vesicle. Increasing the ionic strength of the buffer with NaCl significantly reversed the charge effects. At neutral pH, the transfer protein (pI congruent with 9.0) is expected to be positively charged, which may promote association with the negatively charged donor membrane. Based on these and other experiments, we conclude that the transfer process follows first-order kinetics and that the off-rate of the transfer protein from the donor vesicle surface is the rate-limiting step in the transfer process.


Figures

FIGURE 1
FIGURE 1
Resonance energy transfer assay used to measure the transfer rate of AV-labeled galactosylceramide between small unilamellar donor and acceptor vesicles. (A) Emission spectra of POPC donors vesicles containing 1 mol % AV-GalCer, 1.5 mol % Per-TG, and 10-fold excess of POPC acceptor vesicles (solid line). The dotted line shows the same vesicles after addition of GLTP and after the transfer of AV-GalCer to acceptor vesicles reached equilibrium. The arrow indicates the wavelength (425 nm) where the emission was measured. (B) POPC donor vesicles (40 nmol in 3.0 mL) were added to a sodium phosphate buffer (pH 7.4) and allowed to equilibrate for 5 min at 37 °C. Acceptor vesicles were added (400 nmol), and the system was allowed to equilibrate for another 5 min. Next GLTP was added, 2 μg (84.4 pmol), and the change in fluorescence (ΔFrec) was recorded. (C) Semilogarithmic plot of ln [F/(F - Frec)] versus time for the trace shown in panel B. The slope of this plot was used to calculate the transfer half-time.
FIGURE 2
FIGURE 2
Effect of GLTP concentration increase on AV-GalCer transfer from donor to acceptor vesicles. The fluorescence intensity was converted to picomoles by assuming that the AV-GalCer probe is mass-distributed (like POPC) in the outer and inner leaflets of the small and highly curved donor vesicles. Higher concentrations of GLTP reach the equilibrium level after about 15 min, whereas the lower concentrations ultimately reached the same level. See also Table 1, left two columns.
FIGURE 3
FIGURE 3
Increasing DPPA levels in donor vesicles show a decrease in the kinetic rate of AV-GalCer transfer mediated by GLTP. Trace a represents GLTP-mediated AV-GalCer transfer from POPC donor vesicles, and trace d represents the spontaneous transfer of AV-GalCer from POPC donor vesicles with no addition of GLTP. The amount of GLTP in the a, b, and c experiments was 2.0 μg.
FIGURE 4
FIGURE 4
Effect of negatively charged donor vesicles on the GLTP-mediated AV-GalCer transfer rate. Panel A shows the transfer half-times for 5 and 10 mol % charged donors, and panel B shows the half-times at high sodium chloride concentrations (0.5 M). The amount of GLTP in each experiment was 2.0 μg. Values are averages ± SD of at least 3 different experiments.
FIGURE 5
FIGURE 5
Time course of GLTP-mediated transfer of 1 mol % [3H]GalCer from POPC small unilamellar donor vesicles containing 5 mol % (A) and 10 mol % (B) negatively charged phospholipids to neutral small unilamellar POPC acceptor vesicles. The amount of GLTP in each experiment was 2.0 μg, and the inset shows fitted regression curves.
FIGURE 6
FIGURE 6
Transfer half-times for different negatively charged lipids analyzed by a least-squares procedure from the fitted curves in Figure 5, insets. The amount of GLTP in each experiment was 2.0 μg.
FIGURE 7
FIGURE 7
Effect of increasing concentration of sodium chloride on the transfer rate of AV-GalCer from negatively charged donor vesicles. The inset shows fitted regression curves. Values are averages ± SD of at least 3 different experiments.
FIGURE 8
FIGURE 8
Effect of positively charged donor vesicles on the GLTP-mediated AV-GalCer transfer rate. The solid bars show the transfer half-times for 5-50 mol % charged donors without sodium chloride, and the gray bars show the half-times at high (0.5 M) sodium chloride concentration. The amount of GLTP in each experiment was 2.0 μg. Values are averages ± SD of at least 3 different experiments.
FIGURE 9
FIGURE 9
Transfer half-times for different acceptor vesicle compositions. Panel A shows the transfer rate for negatively charged donors and neutral acceptors, whereas panels B and C show the transfer rate for neutral donors with negatively charged acceptors. The amount of GLTP in each experiment was 2.0 μg. Values are averages ± SD of at least 3 different experiments.

Similar articles

Cited by

References

    1. Maggio B. Prog. Biophys. Mol. Biol. 1994;62:55–117. - PubMed
    1. Merrill AH, Schmelz EM, Dillehay DL, Spiegel S, Shayman JA, Schroeder JJ, Riley RT, Voss KA, Wang E. Toxicol. Appl. Pharmacol. 1997;142:208–225. - PubMed
    1. McAlarney T, Apostolski S, Lederman S, Latov N. J. Neurosci. Res. 1994;37:453–460. - PubMed
    1. Radin NS, Inokuchi J. Biochem. Pharmacol. 1988;37:2879–2886. - PubMed
    1. Anderson RGW. Annu. Rev. Biochem. 1998;67:199–225. - PubMed

Publication types

MeSH terms

LinkOut - more resources