

Femtosecond resolution of ligand-heme interactions in the high-affinity quinol oxidase bd: A di-heme active site?
- PMID: 10660685
- PMCID: PMC26473
- DOI: 10.1073/pnas.030528197
Femtosecond resolution of ligand-heme interactions in the high-affinity quinol oxidase bd: A di-heme active site?
Abstract
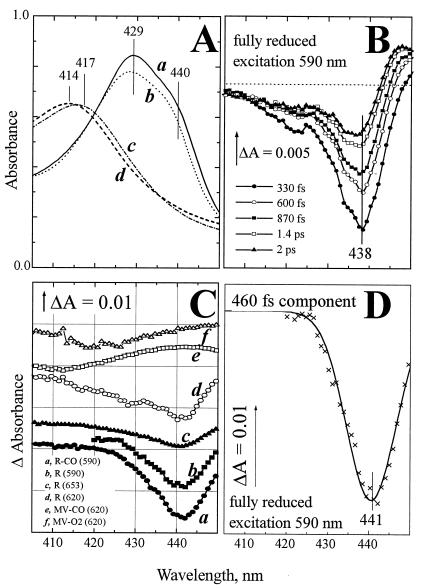
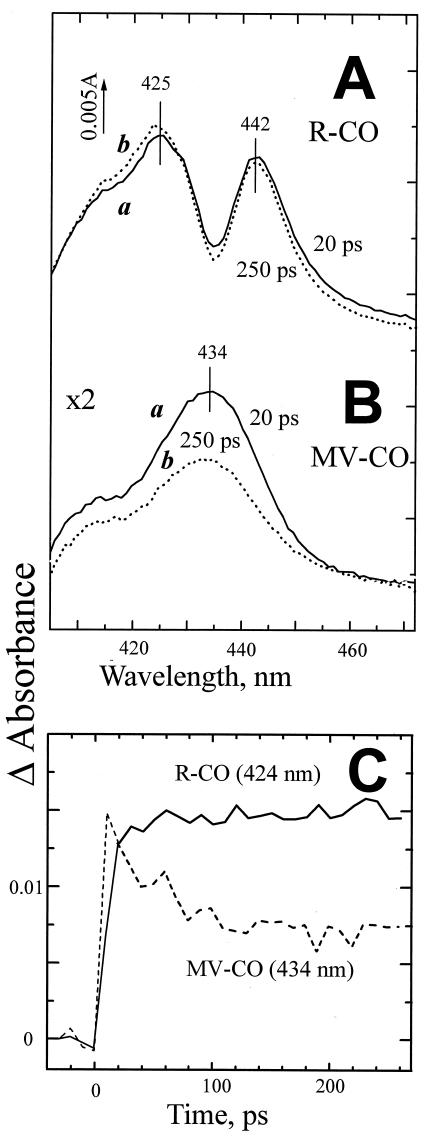
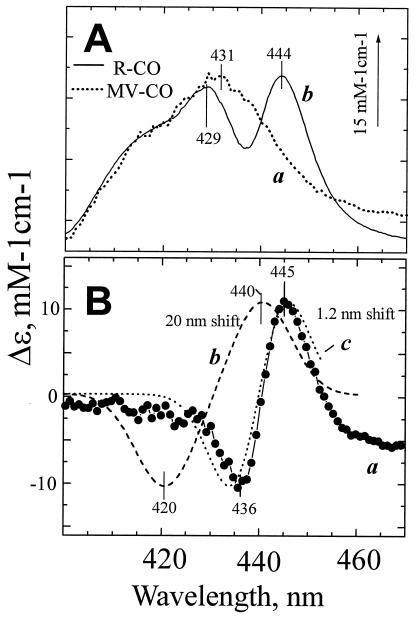
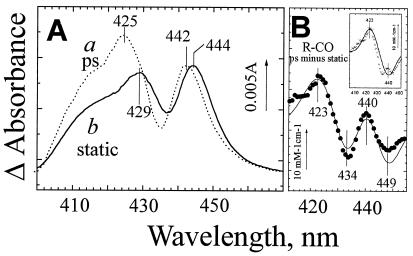
Interaction of the two high-spin hemes in the oxygen reduction site of the bd-type quinol oxidase from Escherichia coli has been studied by femtosecond multicolor transient absorption spectroscopy. The previously unidentified Soret band of ferrous heme b(595) was determined to be centered around 440 nm by selective excitation of the fully reduced unliganded or CO-bound cytochrome bd in the alpha-band of heme b(595). The redox state of the b-type hemes strongly affects both the line shape and the kinetics of the absorption changes induced by photodissociation of CO from heme d. In the reduced enzyme, CO photodissociation from heme d perturbs the spectrum of ferrous cytochrome b(595) within a few ps, pointing to a direct interaction between hemes b(595) and d. Whereas in the reduced enzyme no heme d-CO geminate recombination is observed, in the mixed-valence CO-liganded complex with heme b(595) initially oxidized, a significant part of photodissociated CO does not leave the protein and recombines with heme d within a few hundred ps. This caging effect may indicate that ferrous heme b(595) provides a transient binding site for carbon monoxide within one of the routes by which the dissociated ligand leaves the protein. Taken together, the data indicate physical proximity of the hemes d and b(595) and corroborate the possibility of a functional cooperation between the two hemes in the dioxygen-reducing center of cytochrome bd.
Figures
Similar articles
-
Heme-heme and heme-ligand interactions in the di-heme oxygen-reducing site of cytochrome bd from Escherichia coli revealed by nanosecond absorption spectroscopy.Biochim Biophys Acta. 2010 Sep;1797(9):1657-64. doi: 10.1016/j.bbabio.2010.05.010. Epub 2010 May 28. Biochim Biophys Acta. 2010. PMID: 20529691 Free PMC article.
-
Arginine 391 in subunit I of the cytochrome bd quinol oxidase from Escherichia coli stabilizes the reduced form of the hemes and is essential for quinol oxidase activity.J Biol Chem. 2004 Dec 24;279(52):53980-7. doi: 10.1074/jbc.M408626200. Epub 2004 Oct 8. J Biol Chem. 2004. PMID: 15475358
-
Interactions between heme d and heme b595 in quinol oxidase bd from Escherichia coli: a photoselection study using femtosecond spectroscopy.Biochemistry. 2002 Feb 5;41(5):1654-62. doi: 10.1021/bi0158019. Biochemistry. 2002. PMID: 11814360
-
Probing molecular structure of dioxygen reduction site of bacterial quinol oxidases through ligand binding to the redox metal centers.J Inorg Biochem. 2000 Nov;82(1-4):19-25. doi: 10.1016/s0162-0134(00)00140-9. J Inorg Biochem. 2000. PMID: 11132627 Review.
-
The cytochrome bd respiratory oxygen reductases.Biochim Biophys Acta. 2011 Nov;1807(11):1398-413. doi: 10.1016/j.bbabio.2011.06.016. Epub 2011 Jul 1. Biochim Biophys Acta. 2011. PMID: 21756872 Free PMC article. Review.
Cited by
-
Recent Advances in Structural Studies of Cytochrome bd and Its Potential Application as a Drug Target.Int J Mol Sci. 2022 Mar 15;23(6):3166. doi: 10.3390/ijms23063166. Int J Mol Sci. 2022. PMID: 35328590 Free PMC article. Review.
-
Impact of Hydrogen Sulfide on Mitochondrial and Bacterial Bioenergetics.Int J Mol Sci. 2021 Nov 24;22(23):12688. doi: 10.3390/ijms222312688. Int J Mol Sci. 2021. PMID: 34884491 Free PMC article. Review.
-
Time-resolved electrometric and optical studies on cytochrome bd suggest a mechanism of electron-proton coupling in the di-heme active site.Proc Natl Acad Sci U S A. 2005 Mar 8;102(10):3657-62. doi: 10.1073/pnas.0405683102. Epub 2005 Feb 22. Proc Natl Acad Sci U S A. 2005. PMID: 15728392 Free PMC article.
-
Microsecond time-resolved absorption spectroscopy used to study CO compounds of cytochrome bd from Escherichia coli.PLoS One. 2014 Apr 22;9(4):e95617. doi: 10.1371/journal.pone.0095617. eCollection 2014. PLoS One. 2014. PMID: 24755641 Free PMC article.
-
Aerobic respiratory chain of Escherichia coli is not allowed to work in fully uncoupled mode.Proc Natl Acad Sci U S A. 2011 Oct 18;108(42):17320-4. doi: 10.1073/pnas.1108217108. Epub 2011 Oct 10. Proc Natl Acad Sci U S A. 2011. PMID: 21987791 Free PMC article.
References
-
- Ferguson-Miller S, Babcock G T. Chem Rev. 1996;96:2889–2908. - PubMed
-
- Mitchell P. FEBS Lett. 1987;222:235–245. - PubMed
-
- Mitchell P. Ann NY Acad Sci. 1988;550:185–198. - PubMed
-
- Morgan J E, Verkhovsky M I, Wikström M. J Bioenerg Biomembr. 1994;26:599–608. - PubMed
-
- Rich P R. Biosci Rep. 1991;11:539–571. - PubMed
Publication types
MeSH terms
Substances
LinkOut - more resources
Full Text Sources
