. 2000 Feb 15;97(4):1495-500.
doi: 10.1073/pnas.040552697.

Positive and negative regulation of endogenous genes by designed transcription factors

Affiliations

Positive and negative regulation of endogenous genes by designed transcription factors

R R Beerli et al. Proc Natl Acad Sci U S A. .

Abstract

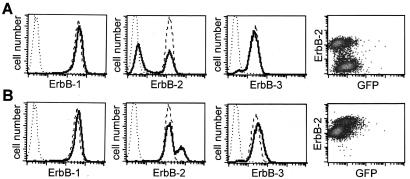
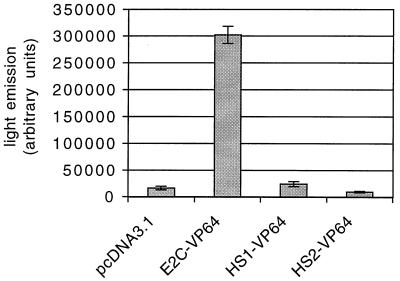
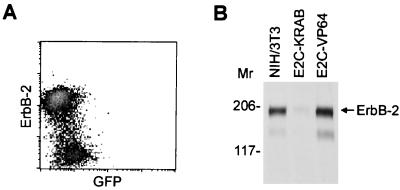
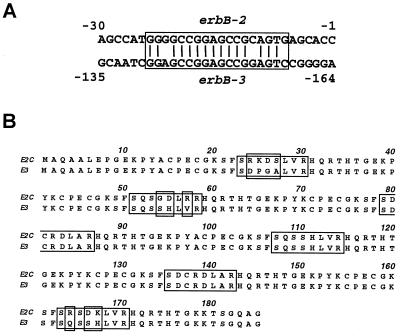
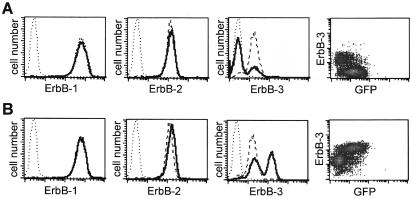
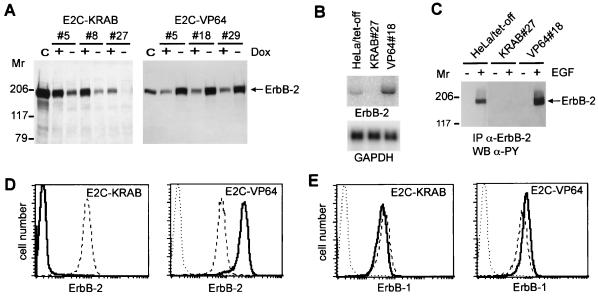
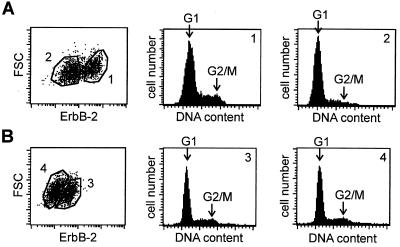
Gene regulation by imposed localization was studied by using designed zinc finger proteins that bind 18-bp DNA sequences in the 5' untranslated regions of the protooncogenes erbB-2 and erbB-3. Transcription factors were generated by fusion of the DNA-binding proteins to repression or activation domains. When introduced into cells these transcription factors acted as dominant repressors or activators of, respectively, endogenous erbB-2 or erbB-3 gene expression. Significantly, imposed regulation of the two genes was highly specific, despite the fact that the transcription factor binding sites targeted in erbB-2 and erbB-3 share 15 of 18 nucleotides. Regulation of erbB-2 gene expression was observed in cells derived from several species that conserve the DNA target sequence. Repression of erbB-2 in SKBR3 breast cancer cells inhibited cell-cycle progression by inducing a G(1) accumulation, suggesting the potential of designed transcription factors for cancer gene therapy. These results demonstrate the willful up- and down-regulation of endogenous genes, and provide an additional means to alter biological systems.


Figures

Figure 1
Figure 1
Retrovirus-mediated erbB-2 gene targeting. A431 cells were infected with E2C-KRAB- (A) or E2C-VP64- (B) encoding retrovirus. Three days later, intact cells were stained with the ErbB-1-specific mAb EGFR1, the ErbB-2-specific mAb FSP77, or the ErbB-3-specific mAb SGP1 in combination with phycoerythrin-labeled secondary antibody, and analyzed by flow cytometry. Dotted lines, control staining (primary antibody omitted) of mock-infected cells; dashed lines, specific staining of mock-infected cells; solid lines, specific staining of, respectively, E2C-KRAB- or E2C-VP64-infected cells.
Figure 2
Figure 2
Luciferase reporter gene assay. HeLa cells were cotransfected with the indicated zinc finger expression plasmids and an erbB-2 promoter (−758 to −1)-luciferase reporter construct. Luciferase activity in total cell extracts was measured 48 h after transfection. Each bar represents the mean value (± standard deviation) of duplicate measurements. HS1 and HS2, three-finger proteins binding, respectively, half-site 1 or half-site 2 of the 18-bp E2C target sequence. pcDNA3.1 is a control plasmid that does not express a transcription factor.
Figure 3
Figure 3
erbB-2 gene targeting in nonhuman cells. (A) Flow cytometric analysis of ErbB-2 expression. COS-7 fibroblasts were infected with E2C-KRAB-encoding retrovirus. Three days later, intact cells were stained with the ErbB-2 specific mAb FSP77 in combination with phycoerythrin-labeled secondary antibody, and analyzed by flow cytometry. (B) ErbB-2 Western blot. NIH 3T3 fibroblasts were mock-infected or infected with E2C-KRAB- or E2C-VP64-encoding retrovirus. Three days later, protein extracts were prepared and subjected to Western blotting with the ErbB-2-specific antiserum 21N. Mr, molecular weight × 10−3.
Figure 4
Figure 4
(A) Alignment of E2C target sequence in the erbB-2 5′-UTR with the E3 target sequence in the erbB-3 5′-UTR. Numbers indicate the distance from the ATG translation initiation codon. (B) Amino acid sequence alignment of E2C and E3 proteins. DNA recognition helix sequence positions −1 to 6 of each finger, as well as sequence differences, are boxed.
Figure 5
Figure 5
Retrovirus-mediated erbB-3 gene targeting. A431 cells were infected with E3-KRAB- (A) or E3-VP64- (B) encoding retrovirus. Three days later, intact cells were stained with the ErbB-1 specific mAb EGFR1, the ErbB-2 specific mAb FSP77, or the ErbB-3 specific mAb SGP1 in combination with phycoerythrin-labeled secondary antibody, and analyzed by flow cytometry. Dotted lines, control staining (primary antibody omitted) of mock-infected cells; dashed lines, specific staining of mock-infected cells; solid lines, specific staining of, respectively, E3-KRAB- or E3-VP64-infected cells.
Figure 6
Figure 6
erbB-2 gene targeting in stable HeLa cell clones. (A) ErbB-2 Western blot. The indicated E2C-KRAB- and E2C-VP64-expressing clones were maintained in the presence or absence of 2 μg/ml Dox for 4 days. Protein extracts from these cells were subjected to Western blotting with the ErbB-2 specific antiserum 21N. Lane C, HeLa/tet-off extract. (B) Northern blot. Total RNA extracted from the indicated cell lines maintained in the absence of Dox for 4 days was subjected to Northern blotting with an erbB-2 specific probe. The membrane was stripped and reprobed with a glyceraldehyde-3-phosphate (GAPDH)-specific probe as a control. (C) Epidermal growth factor (EGF)-induced tyrosine phosphorylation of ErbB-2. The indicated cell lines were maintained in the absence of Dox for 4 days, serum starved overnight, and either induced with 100 ng/ml EGF for 10 min at room temperature or left untreated. ErbB-2 was immunoprecipitated (IP) from protein extracts with antiserum 21N and analyzed by Western blotting (WB) with mAb PY20. (D and E) Flow cytometric analysis of ErbB-2 and ErbB-1 expression. Cells were maintained for 4 days in the absence of Dox, stained with mAbs FSP77 or EGFR1 in combination with phycoerythrin-labeled secondary antibody, and analyzed for their fluorescence in a FACScan (Becton Dickinson). Dotted lines, control staining (primary antibody omitted) of HeLa/tet-off cells; dashed lines, specific stainings of HeLa/tet-off cells; solid lines, specific stainings of, respectively, Dox-deprived KRAB clone 27 and VP64 clone 18.
Figure 7
Figure 7
Flow cytometric cell cycle analysis. SKBR3 (A) and T47D cells (B) were infected with E2C-KRAB-encoding retrovirus. Three days later, cells were stained with the ErbB-2-specific mAb FSP77 in combination with fluorescein-labeled secondary antibody (Left), as well as with 7-aminoactinomycin to show cell cycle distribution by DNA content (Center and Right), and analyzed by flow cytometry. Cell cycle histograms were generated from cells gated as indicated by numbers. FSC, forward scattered light.

Similar articles

Cited by

References

    1. Zaug A J, Been M D, Cech T R. Nature (London) 1986;324:429–433. - PubMed
    1. Matteucci M D, Wagner R W. Nature (London) 1996;384:20–22. - PubMed
    1. Gottesfeld J M, Neely L, Trauger J W, Baird E E, Dervan P B. Nature (London) 1997;387:202–205. - PubMed
    1. Ptashne M, Gann A. Curr Biol. 1998;8:812–822. - PubMed
    1. Desjarlais J R, Berg J M. Proc Natl Acad Sci USA. 1992;89:7345–7349. - PMC - PubMed

Publication types

MeSH terms