. 2000 Feb 15;20(4):1374-85.
doi: 10.1523/JNEUROSCI.20-04-01374.2000.

Interplay between facilitation, depression, and residual calcium at three presynaptic terminals

Affiliations

Interplay between facilitation, depression, and residual calcium at three presynaptic terminals

J S Dittman et al. J Neurosci. .

Abstract

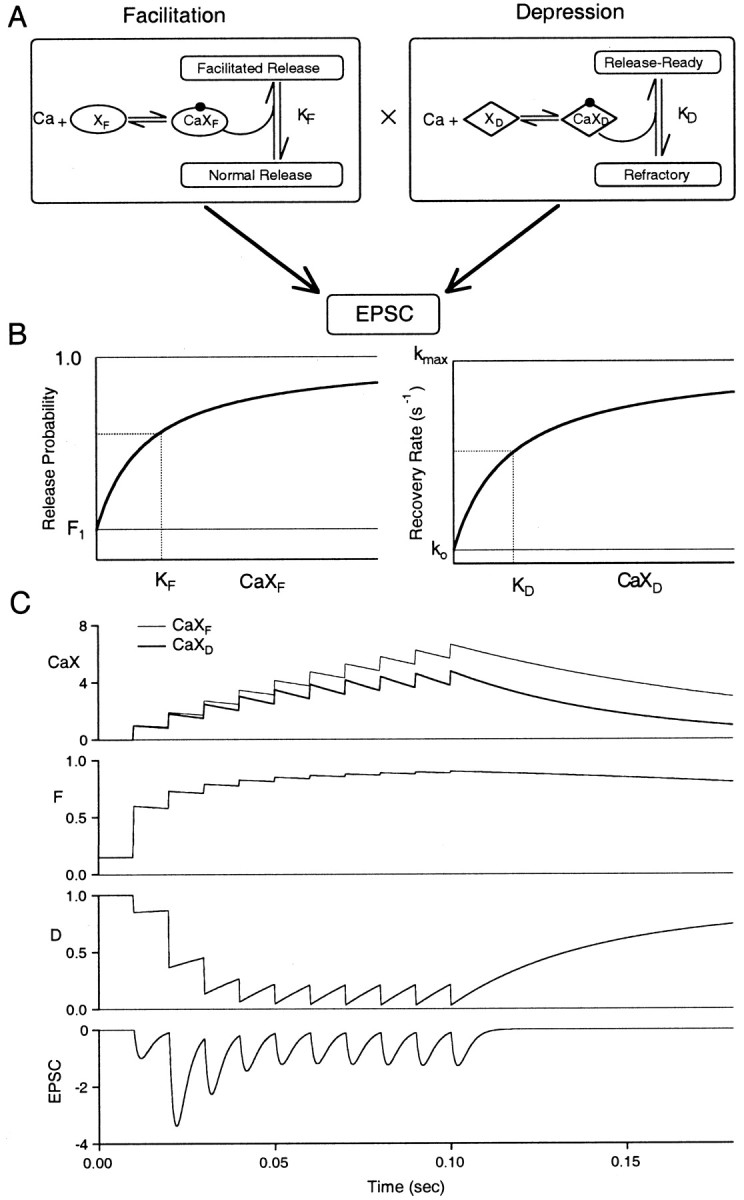
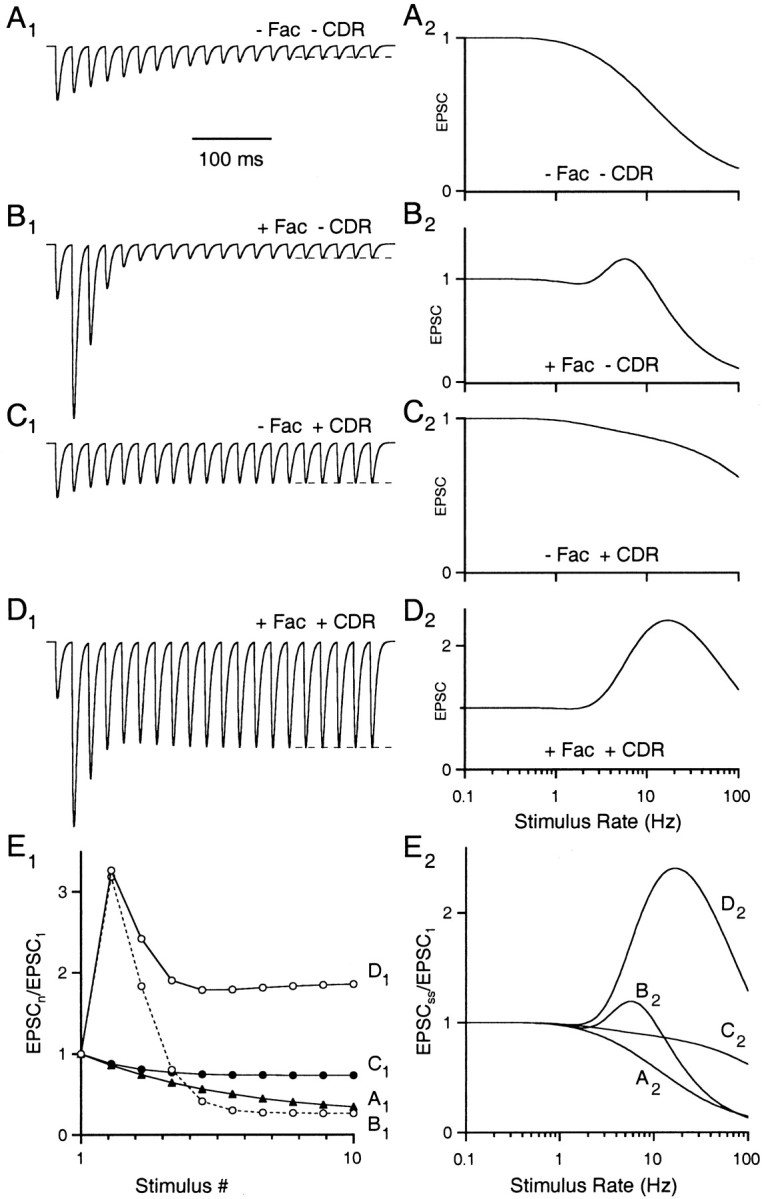
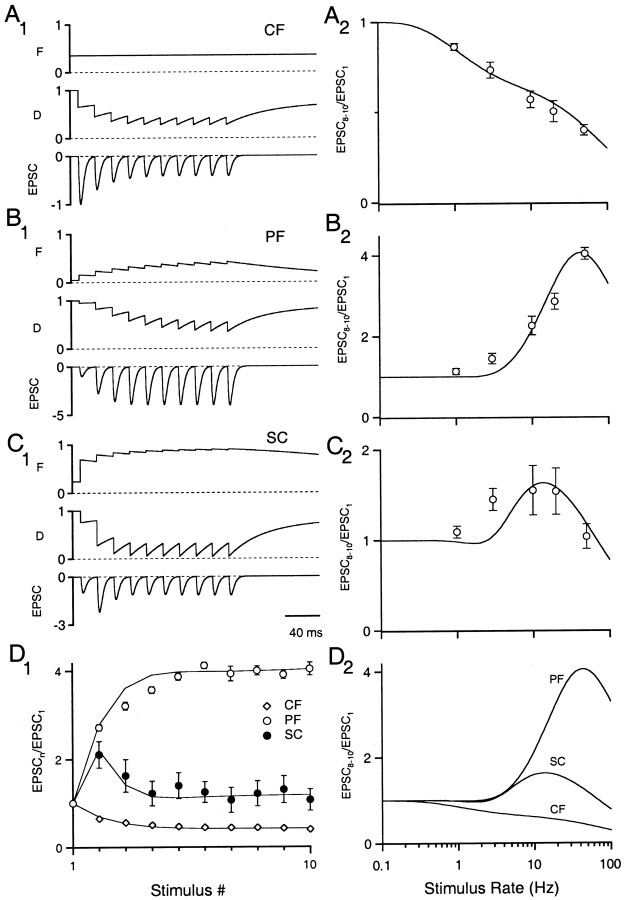
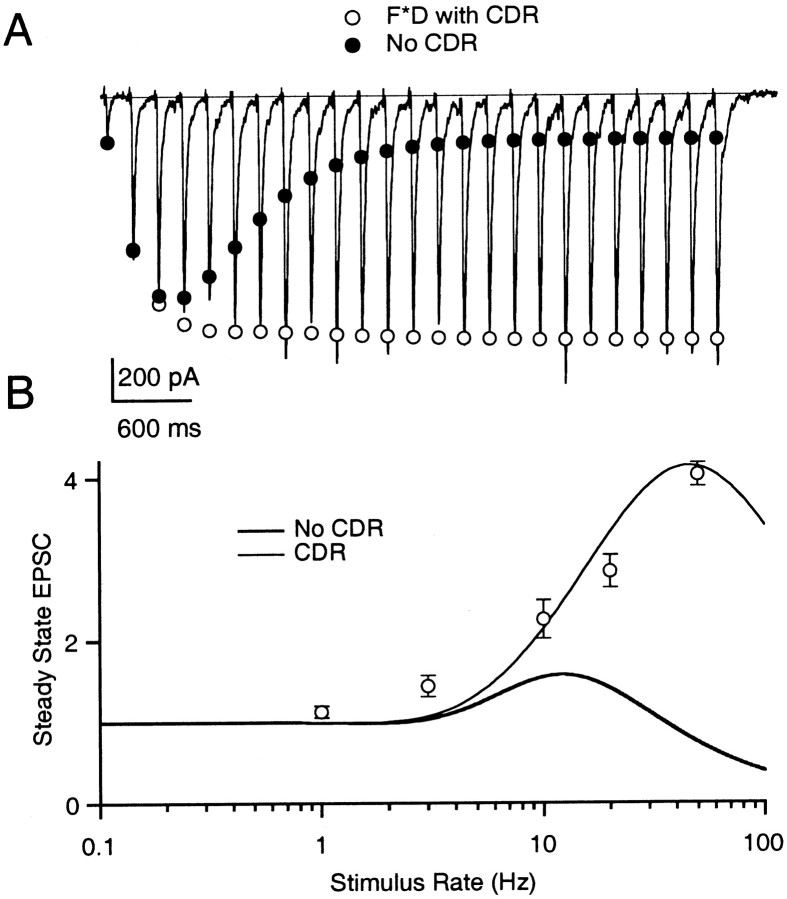
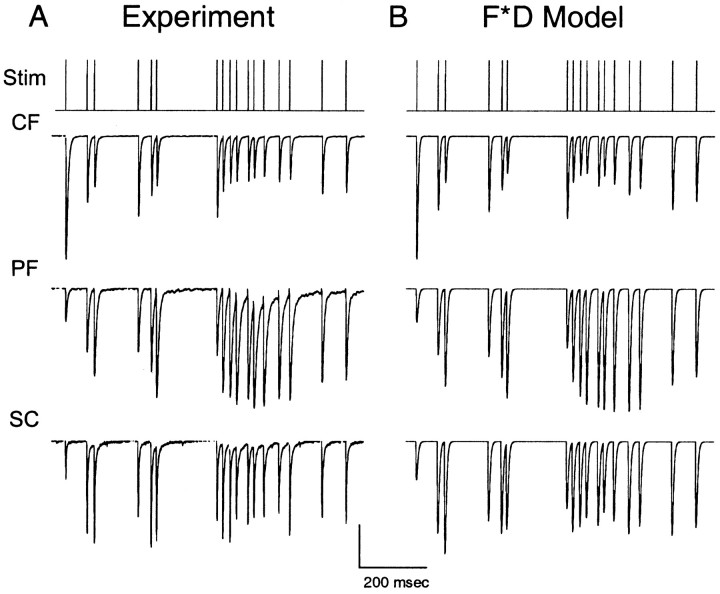
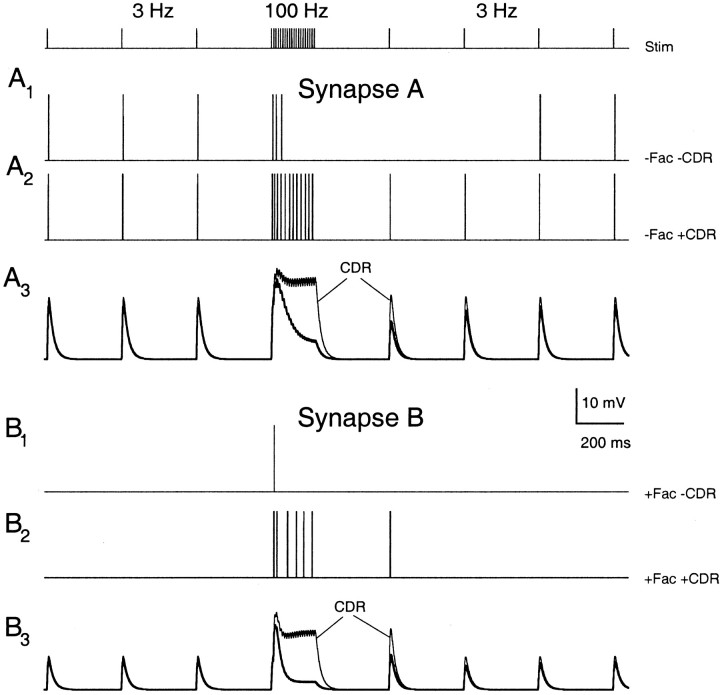
Synapses display remarkable alterations in strength during repetitive use. Different types of synapses exhibit distinctive synaptic plasticity, but the factors giving rise to such diversity are not fully understood. To provide the experimental basis for a general model of short-term plasticity, we studied three synapses in rat brain slices at 34 degrees C: the climbing fiber to Purkinje cell synapse, the parallel fiber to Purkinje cell synapse, and the Schaffer collateral to CA1 pyramidal cell synapse. These synapses exhibited a broad range of responses to regular and Poisson stimulus trains. Depression dominated at the climbing fiber synapse, facilitation was prominent at the parallel fiber synapse, and both depression and facilitation were apparent in the Schaffer collateral synapse. These synapses were modeled by incorporating mechanisms of short-term plasticity that are known to be driven by residual presynaptic calcium (Ca(res)). In our model, release is the product of two factors: facilitation and refractory depression. Facilitation is caused by a calcium-dependent increase in the probability of release. Refractory depression is a consequence of release sites becoming transiently ineffective after release. These sites recover with a time course that is accelerated by elevations of Ca(res). Facilitation and refractory depression are coupled by their common dependence on Ca(res) and because increased transmitter release leads to greater synaptic depression. This model captures the behavior of three different synapses for various stimulus conditions. The interplay of facilitation and depression dictates synaptic strength and variability during repetitive activation. The resulting synaptic plasticity transforms the timing of presynaptic spikes into varying postsynaptic response amplitudes.


Figures

Fig. 1.
Fig. 1.
Effects of presynaptic plasticity on synaptic transmission. A, Representative spike train recorded from the basal ganglia of an awake, behaving macaque. B, C, Simulated EPSPs resulting from the stimulus in A (see Materials and Methods). The mean peak EPSPs were the same in both examples (i.e., synaptic currents were normalized to give the same average depolarization). The only difference between the presynaptic terminals in B and C is the amount of facilitation and initial release probability (F1). Comparison of the traces reveals the different temporal patterns of depolarization associated with each type of presynaptic plasticity. The postsynaptic cell was simulated using a passive single compartment model with parameters τm = 20 msec, Vrest = −70 mV, RN = 100 MΩ. The FD model parameters for B were ρ = 3.1, F1 = 0.05, τF = 100 msec, τD = 50 msec, kmax= 30 sec−1, ko = 2 sec−1, KD = 2. Model parameters for C were ρ = 2.2, F1 = 0.24, τF = 100 msec, τD = 50 msec, kmax= 30 sec−1, ko = 2 sec−1, KD = 2. The spike train in A was kindly provided by John Assad and Irwin Lee.
Fig. 2.
Fig. 2.
Diversity of short-term plasticity in the CNS. A, Top, Climbing fiber to Purkinje cell EPSCs (CF); middle, parallel fiber to Purkinje cell EPSCs (PF); bottom, CA3 to CA1 Schaffer collateral EPSCs (SC) recorded while stimulating afferents at 50 Hz for 10 stimuli at 34°C. Traces are averages of four to six trials each. Stimulus artifacts were suppressed for clarity. Vertical scale bar is 2, 400, and 60 pA for the CF, PF, and SC synapses, respectively. B, Average magnitude of the 8th–10th EPSC normalized by the first EPSC plotted as a function of stimulus frequency for the climbing fiber (top), the parallel fiber (middle), and the Schaffer collateral (bottom) synapses. Data are shown as mean ± SEM (n = 4–5). C, Measurement of parallel fiber Cares during a 10 pulse, 50 Hz stimulus train using the calcium-sensitive indicator magnesium green. Vertical scale bar is percentage ΔF/F. Parallel fiber data were adapted fromKreitzer and Regehr (2000).
Fig. 3.
Fig. 3.
FD model for Ca-dependence of short-term plasticity. A, Left, Residual presynaptic calcium binds to site XF, and the complex CaXF then binds to the release site causing an enhancement of release probability. Right, Schematic of residual presynaptic calcium binding to site XD, which then binds with the refractory release site driving a transition back to the release-ready state. B, Left, F plotted as a function of CaXF ranging from a minimal probability of F1 (no residual calcium) to a maximum of 1. The dissociation constant for CaXF is KF.Right, the recovery rate for depression is plotted as a function of CaXD with a minimum rate of ko, a maximum rate of kmax, and CaXDdissociation constant KD. C, Presynaptic levels of CaXF (thin line) and CaXD (thick line), fraction of available synapses that undergo release (F), fraction of release-ready synapses (D), and normalized EPSC during a train of 10 stimuli at 100 Hz. Model parameters for this simulation were ρ = 3.4, F1 = 0.15, τF = 100 msec, τD = 50 msec, kmax = 30 sec−1, ko = 2 sec−1, KD = 2. Note that CaXF and CaXD were normalized to their respective dissociation constants.
Fig. 4.
Fig. 4.
Effects of facilitation and CDR on presynaptic dynamics. A1, Simulation of 20 EPSCs generated at 50 Hz in a reduced FD model with no facilitation or CDR.Dashed line represents the steady-state EPSC size. A2, Steady-state EPSC magnitude (normalized to the first EPSC) as a function of stimulus frequency. B, Same as A for a simulation with facilitation only. C, Same as A for a simulation model with CDR only. D, Same as A for a simulation with both facilitation and CDR. Equations 19 and 21 were used with model parameters from Figure 3. E1, EPSC peak amplitudes versus stimulus number for the four model synapses. E2, Steady-state EPSC versus frequency curves from A2 to D2 are superimposed. For A and C, F was held constant at F1. For A and B, the recovery rate was held constant at ko.
Fig. 5.
Fig. 5.
Application of the FD model to real synapses. A1, F, D, and EPSC size during a 10 pulse 50 Hz stimulus train for a model climbing fiber to Purkinje cell synapse. A2, Amplitude of the 8th–10th EPSC (taken from Fig. 2B) plotted against stimulus frequency. Solid line is the analytical solution given in Equation 21. Model parameters were F1 = 0.35 for A1, τD = 50 msec, kmax = 20 sec−1, ko = 0.7 sec−1, KD = 2. B1, B2, Same as A for the parallel fiber to Purkinje cell synapse. Model parameters for both B1 and B2 were ρ = 3.1, F1 = 0.05, τF = 100 msec, τD = 50 msec, kmax= 30 sec−1, ko = 2 sec−1, KD = 2. C1, C2, Same as A for the CA3 to CA1 Schaffer collateral synapse. Model parameters were ρ = 2.2, F1 = 0.24 for C, τF = 100 msec, τD = 50 msec, kmax = 30 sec−1, ko = 2 sec−1, KD = 2. D1, Normalized average EPSC magnitude during a 50 Hz stimulus versus stimulus number. Open circlesrepresent mean EPSC amplitudes during 50 Hz trains plotted against stimulus number for the climbing fiber (CF), parallel fiber (PF), and Schaffer collateral (SC) synapses. Data are mean ± SEM with n = 5–7. D2, FD model fits to the steady-state data in A2–C2 superimposed for comparison.
Fig. 6.
Fig. 6.
Importance of CDR at “low P” synapses. A, Parallel fiber to Purkinje cell EPSCs recorded during 25 stimuli at 50 Hz. Trace represents a single trial. Open circles are the predicted FD model EPSC magnitudes using Equation19. Filled circles represent the same FD model without CDR (CaXD = 0). B, Steady-state EPSC size plotted against stimulus frequency for the parallel fiber synapse with (thin line) and without (thick line) CDR.Open circles are parallel fiber data from Figure 2B. Model parameters were ρ = 3.8, F1 = 0.038, τF = 100 msec, τD = 50 msec, kmax= 30 sec−1, ko = 2 sec−1, KD = 2.
Fig. 7.
Fig. 7.
Presynaptic dynamics during Poisson stimulus trains. A, Examples of EPSCs recorded in response to an irregular stimulus train with average rate 20 Hz at the climbing fiber (CF), parallel fiber (PF), and Schaffer collateral (SC) synapases. Stimulus artifacts were suppressed for clarity. B, FD model simulations for the three synapses. Vertical scale bar is 1, 400, and 200 pA for the CF, PF, and SC synapses, respectively. Model parameters for CF wereF1 = 0.57, τD = 50 msec,kmax = 30 sec−1,ko = 2 sec−1,KD = 3.6. Model parameters for PF were ρ = 2.7, F1 = 0.05, τF = 100 msec, τD = 50 msec,kmax = 30 sec−1,ko = 2 sec−1,KD = 2. Model parameters for SC were ρ = 3.2, F1 = 0.1, τF = 100 msec, τD = 50 msec,kmax = 18 sec−1,ko = 2 sec−1,KD = 1.8. Parallel fiber data adapted fromKreitzer and Regehr (2000).
Fig. 8.
Fig. 8.
Potential postsynaptic effects of facilitation and CDR. A1, A2, Postsynaptic responses of a model integrate-and-fire neuron using a single nonfacilitating presynaptic input stimulated at 3 Hz with a 100 Hz burst. CDR is absent in A1 (−Fac, −CDR) and present in A2 (−Fac, +CDR). Synapse A had an initial peak conductance of 15 nS (suprathreshold). A3, Postsynaptic potentials for synapse A with (thin lines) and without CDR (thick lines). B1, B2, Postsynaptic responses given the same presynaptic stimulus but facilitation was included. Synapse B had an initial conductance of 6 nS (subthreshold). CDR was absent in B1 (+Fac, −CDR) and present in B2 (+Fac, +CDR). B3, Postsynaptic potentials for synapse B with (thin lines) and without CDR (thick lines). Model parameters for synapse A were F1 = 0.24, τD = 50 msec, kmax = 30 sec−1, ko = 2 sec−1, KD = 2. Model parameters for synapse B were ρ = 2.5, F1 = 0.24, τF = 100 msec, τD = 50 msec, kmax = 30 sec−1, ko = 2 sec−1, KD = 2. Postsynaptic integrate-and-fire neuron parameters: Vrest = −70 mV, Vthresh = −55 mV, τm = 20 msec, RN = 100 MΩ.

References

    1. Abbott LF, Sen K, Varela JA, Nelson SB. Synaptic depression and cortical gain control. Science. 1997;275:220–222. - PubMed
    1. Atluri PP, Regehr WG. Determinants of the time course of facilitation at the granule cell to Purkinje cell synapse. J Neurosci. 1996;16:5661–5671. - PMC - PubMed
    1. Bertram R, Sherman A, Stanley EF. Single-domain/bound calcium hypothesis of transmitter release and facilitation. J Neurophysiol. 1996;75:1919–1931. - PubMed
    1. Betz WJ. Depression of transmitter release at the neuromuscular junction of the frog. J Physiol (Lond) 1970;206:629–644. - PMC - PubMed
    1. Delaney KR, Tank DW. A quantitative measurement of the dependence of short-term synaptic enhancement on presynaptic residual calcium. J Neurosci. 1994;14:5885–5902. - PMC - PubMed

Publication types

LinkOut - more resources