. 2000 Mar 1;28(5):1045-52.
doi: 10.1093/nar/28.5.1045.

A novel RNA-binding protein from Triturus carnifex identified by RNA-ligand screening with the newt hammerhead ribozyme

Affiliations

A novel RNA-binding protein from Triturus carnifex identified by RNA-ligand screening with the newt hammerhead ribozyme

M A Denti et al. Nucleic Acids Res. .

Abstract

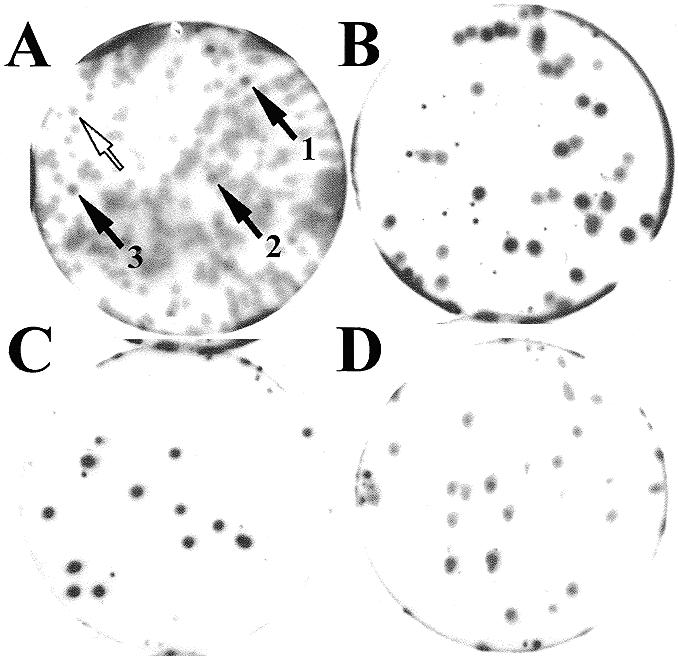
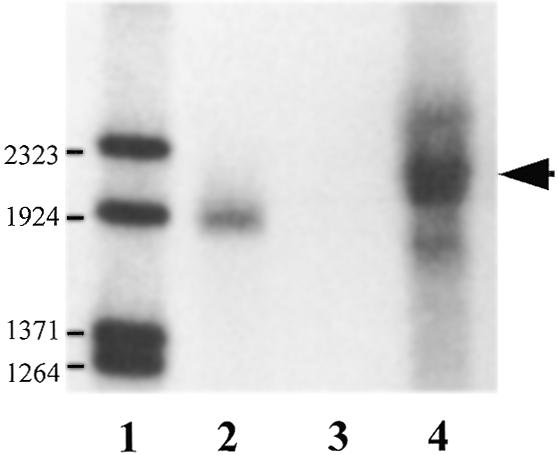
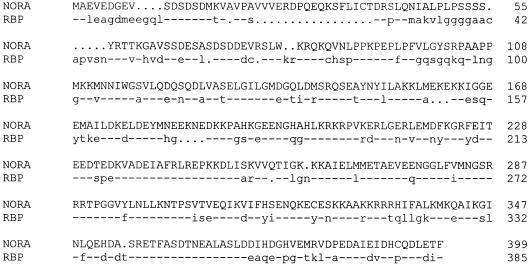
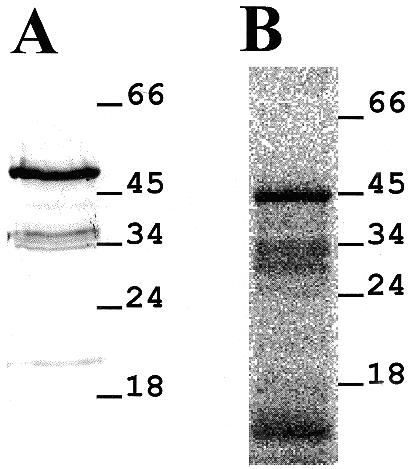
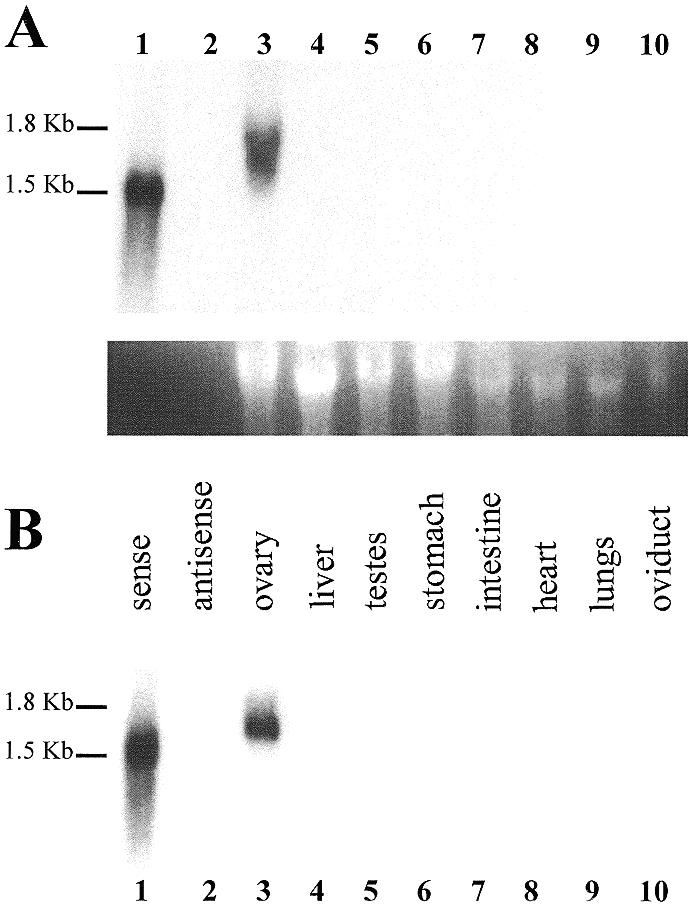
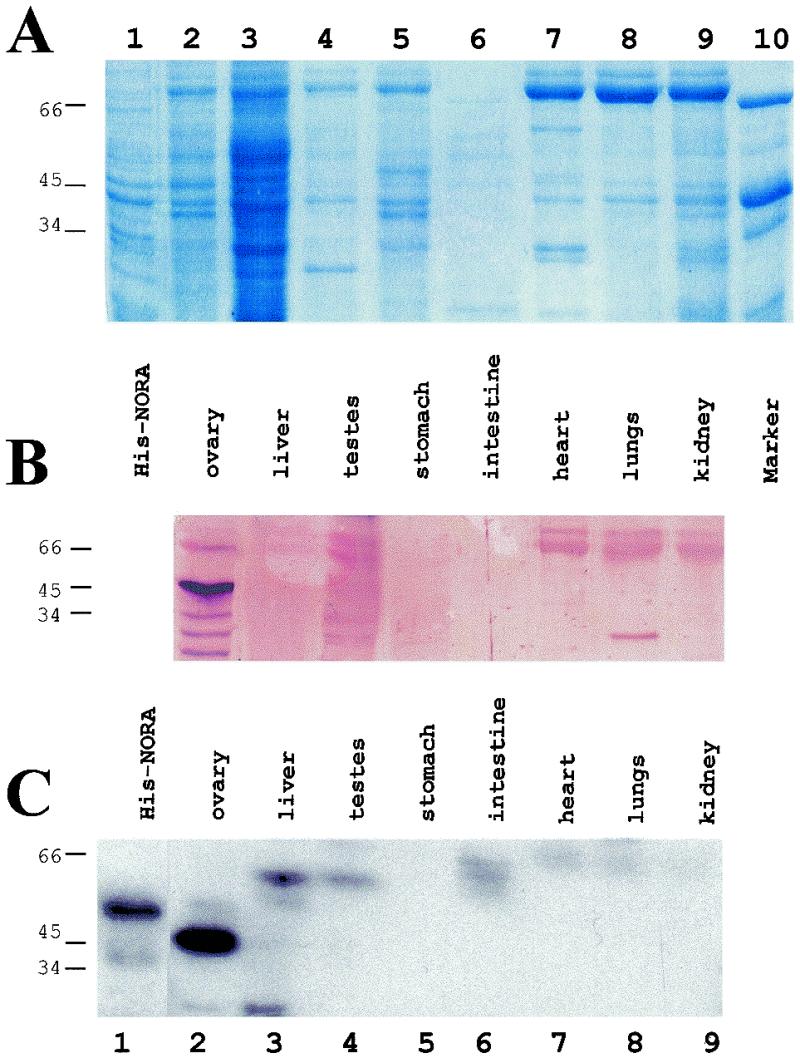
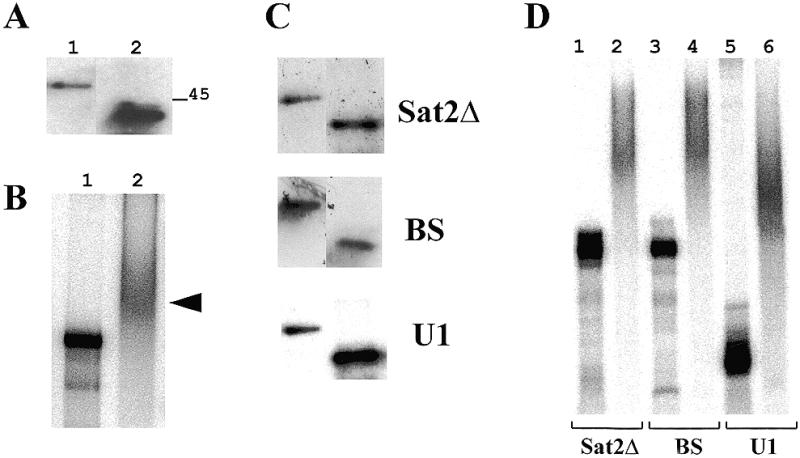
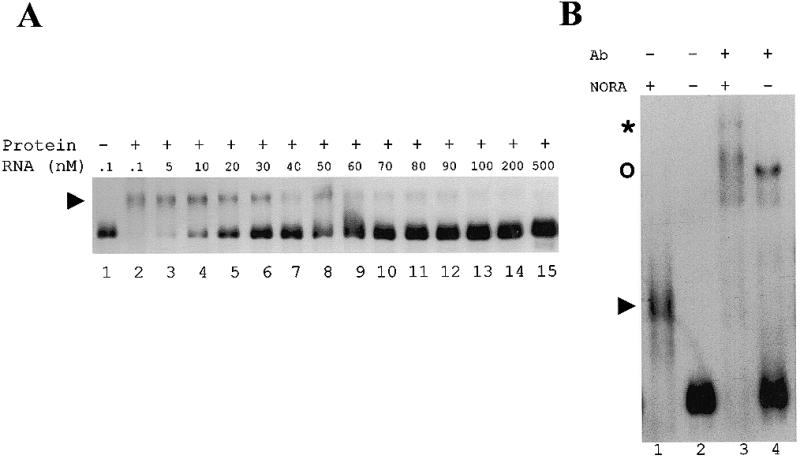
The newt hammerhead ribozyme is transcribed from Satellite 2 DNA, which consists of tandemly repeated units of 330 bp. However, different transcripts are synthesized in different tissues. In all somatic tissues and in testes, dimeric and multimeric RNA transcripts are generated which, to some extent, self-cleave into monomers at the hammerhead domain. In ovaries, primarily a distinct monomeric unit is formed by transcription, which retains an intact hammerhead self-cleavage site. The ovarian monomeric RNA associates to form a 12S complex with proteins that are poorly characterised so far. In this work we identified NORA, a protein that binds the ovarian form of the newt ribozyme. We show that the newt ribozyme binds to the Escherichia coli -expressed protein, as well as to a protein of identical size that is found exclusively in newt ovaries. Also NORA mRNA was detectable only in ovary, but in neither somatic tissues nor testes. The tissue-specific expression of NORA is analogous to the ovary-specific transcription of the newt ribozyme. Although NORA was identified by its ability to bind to the newt ribozyme in the presence of a vast excess of carrier RNA, it was able to interact with certain other RNA probes. This novel RNA-binding protein does not contain any motif characteristic for RNA-binding proteins or any other known protein domain, but it shares a striking similarity with a rat resiniferatoxin-binding protein.


Figures

Figure 1
Figure 1
Secondary (A) and tertiary screening (B–D) of λZ-NORA clone. (A) Clones picked from the primary screening were plated at ∼200 p.f.u./plate. The black arrows show the plaques corresponding to three clones of λZ-NORA, which were subsequently found to be identical. The empty arrow shows an example of non-ribozyme-binding (negative) plaque. Clone λZ-NORA picked from secondary screening was plated pure (∼15 p.f.u./plate) (C) or mixed with ∼20 p.f.u. from the λ ZAPII cDNA library (B), as a negative control. The same amount of phages from λ ZAPII library was also plated alone (D). Plaques were induced with IPTG and transferred to filters, as described in Materials and Methods. Binding was performed with 32P-labelled Sat2 probe (2 × 10⁵ c.p.m./ml) in SB buffer containing 0.1 mg/ml yeast RNA. Where a mixture had been plated, the ratio of positive:negative plaques, which could be discriminated by their signal intensity, was as expected.
Figure 2
Figure 2
Northern blot analysis of NORA mRNA in T.carnifex ovary. RNA samples were fractionated in a 0.8% agarose/formaldehyde gel. The blot was hybridised with 32P-labelled NORA antisense probe. Lane 1, lambda DNA/BstEII end-labelled molecular weight marker; lane 2, NORA sense cold transcript (1530 nt); lane 3, NORA antisense cold transcript; lane 4, 15 µg total RNA from T.carnifex ovary. Numbers on the left refer to the size of the DNA fragments. The arrow on the right points to the signal corresponding to NORA mRNA.
Figure 3
Figure 3
Multiple alignment of deduced amino acid sequence of NORA protein and of a RBP protein of 385 amino acids obtained by joining ORF 31–733 with ORF 700–1182 of RBP-26 cDNA. Numbers on the right refer to the position of the last residue of a line. The alignment was performed with the program PILEUP. This algorithm introduces gaps to maximise the similarities and these are denoted by dots. Amino acids identical to NORA sequence are denoted by dashes and those amino acids which differ from NORA are indicated by single lowercase letters.
Figure 4
Figure 4
NORA protein expression. (A) Western blot analysis. pHis-NORAfull was expressed in E.coli and the total protein extract was electrophoresed on a 12% SDS–polyacrylamide gel, transferred to a nitrocellulose membrane and detected by the Penta-His antibody. Relative migration of size standards is shown on the right side of the panel. (B) In vitro translation. Rabbit reticulocyte lysates were used to translate His-NORAfull cRNA in [35S]methionine labelled proteins. A radioautograph of a 12% polyacrylamide gel is shown with molecular weights of markers in kDa shown on the right.
Figure 5
Figure 5
Northern blot analysis of NORA mRNA expression pattern in various newt tissues. Total RNA (A) and poly(A)+ RNA (B) samples from T.carnifex ovary, testes and somatic tissues were fractionated on 1% agarose/formaldehyde gels. The blots were hybridised with 32P-labelled NORA antisense probe. (A) Lane 1, NORA sense cold transcript (1530 nt); lane 2, NORA antisense cold transcript; lanes 3–10, total RNA (10 µg) from T.carnifex tissues. Exposure time was 3 days. Ethidium bromide staining of the 18S rRNA was used as a loading control. (B) Same as (A), except that poly(A)+ RNA extracted from 10 µg of total RNA was loaded in lanes 3–10.
Figure 6
Figure 6
Analysis of NORA protein presence in various newt tissues. (A) Total extracts (corresponding to ∼2 mg of tissue) were separated by electrophoresis on a 12% SDS–polyacrylamide gel, which was Coomassie stained. Total protein extract from His-NORAfull expressing E.coli was loaded as positive control (lane 1). Lane 10, protein size marker. (B) A duplicate gel was run in parallel, transferred to nitrocellulose membrane and subjected to immunoblot analysis with a NORA-specific rabbit polyclonal antibody. (C) A third identical gel was transferred to nitrocellulose membrane and probed with 32P-labelled Sat2 in SB buffer containing 0.1 mg/ml yeast RNA. Exposure time was 4 h. Molecular weights of markers in kDa are shown on the left. Only in ovarian extracts could a strong signal be detected. The size of the signal was identical regardlessof whether the antibody or the RNA probe was used.
Figure 7
Figure 7
Binding of purified NORA protein to Sat2 RNA and other diverse RNA probes. (A) Northwestern blot analysis. Purified His-tagged NORAfull (lane 1) and His-NORA (lane 2) proteins (1 µg) were subjected to electrophoresis on a 12% SDS–polyacrylamide gel, transferred to nitrocellulose membrane and probed with 32P-labelled Sat2 in SB buffer containing 0.1 mg/ml yeast RNA. Relative migration of the size standard is shown on the right of the panel. (B) Gel mobility shift analysis was performed with the radiolabelled Sat2 RNA (10 pM; 3000 c.p.m.) in the absence (lane 1) or presence (lane 2) of recombinant His-NORA protein (6 µM). The reaction was performed in SB buffer (see Materials and Methods) containing 500 ng/µl yeast RNA. Samples were separated on a 6% polyacrylamide gel. The arrow on the right indicates the shifted band. (C) Northwestern blot analysis performed as in (A), using the probes indicated on the right of the panels. (D) Gel mobility shift analysis performed with diverse RNA probes in the absence (lanes 1, 3 and 5) or presence (lanes 2, 4 and 6) of recombinant His-NORA protein, as described in (B). Lanes 1 and 2, Sat2Δ RNA; lanes 3 and 4, BS RNA; lanes 5 and 6, potato U1 RNA.
Figure 8
Figure 8
Analysis of NORA binding to Sat2Δ RNA. (A) Gel mobility shift assay. The His-NORA protein concentration was held constant at 100 nM and the RNA concentration was varied between 100 pM and 500 nM (lanes 2–15). The total amount of labelled RNA was kept constant in the binding reaction (1000 c.p.m.), but the specific activity of the RNA was varied. In lane 1 no protein was added. The complexes were separated from the unbound RNAs on a 5% polyacrylamide gel. The arrowhead on the left shows the shifted complex. (B) Antibody supershift assay. Sat2Δ RNA (100 pM) was incubated in the presence (lanes 1 and 3) or absence (lanes 2 and 4) of His-NORA protein (100 nM). After 15 min incubation at 25°C, a rabbit polyclonal NORA-specific antibody was added at a final concentration 1:500 (lanes 3 and 4). The arrowhead on the left shows the shifted complex in lane 1. The asterisk indicates the supershift in lane 3. The upper band in lane 4 (indicated by a circle) is due to a non-specific interaction of the immune serum with the RNA probe.

References

    1. Birikh K.R., Heaton,P.A. and Eckstein,F. (1997) Eur. J. Biochem., 245, 1–16. - PubMed
    1. Symons R.H. (1997) Nucleic Acids Res., 25, 2683–2689. - PMC - PubMed
    1. Epstein L.M., Mahon,K.A. and Gall,J.G. (1986) J. Cell Biol., 103, 1137–1144. - PMC - PubMed
    1. Epstein L.M. and Gall,J.G. (1987) Cell, 48, 535–543. - PubMed
    1. Ferbeyre G., Smith,J.M. and Cedergren,R. (1998) Mol. Cell. Biol., 18, 3880–3888. - PMC - PubMed

Publication types

Associated data