

Gender effects on age-related changes in brain structure
- PMID: 10669234
- PMCID: PMC7976349
Gender effects on age-related changes in brain structure
Abstract
Background and purpose: Previous reports have suggested that brain atrophy is associated with aging and that there are gender differences in brain atrophy with aging. These reports, however, neither exclude silent brain lesions in "healthy subjects" nor divide the brain into subregions. The aim of this study is to clarify the effect of gender on age-related changes in brain subregions by MR imaging.
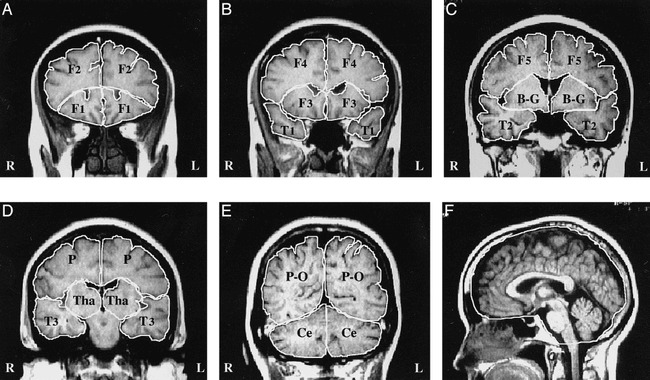
Methods: A computer-assisted system was used to calculate the brain matter area index (BMAI) of various regions of the brain from MR imaging of 331 subjects without brain lesions.
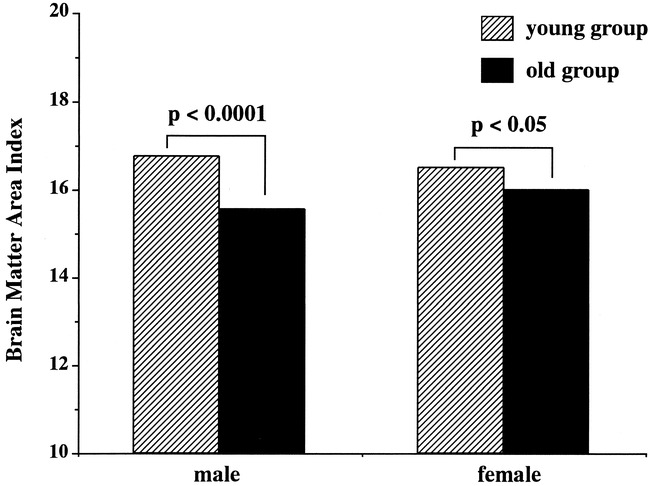
Results: There was significantly more brain atrophy with aging in the posterior parts of the right frontal lobe in male subjects than there was in female subjects. Age-related atrophy in the middle part of the right temporal lobe, the left basal ganglia, the parietal lobe, and the cerebellum also was found in male subjects, but not in female subjects. In the temporal lobe, thalamus, parieto-occipital lobe, and cerebellum, brain volume in the left hemisphere is significantly smaller than in the right hemisphere; sex and age did not affect the hemisphere differences of brain volume in these regions.
Conclusion: The effect of gender on brain atrophy with aging varied in different subregions of the brain. There was more brain atrophy with aging in male subjects than in female subjects.
Figures
Similar articles
-
Changes of brain structure in Parkinson's disease patients with mild cognitive impairment analyzed via VBM technology.Neurosci Lett. 2017 Sep 29;658:121-132. doi: 10.1016/j.neulet.2017.08.028. Epub 2017 Aug 18. Neurosci Lett. 2017. PMID: 28823894
-
Selective atrophy of left hemisphere and frontal lobe of the brain in old men.J Gerontol A Biol Sci Med Sci. 2005 Feb;60(2):165-74. doi: 10.1093/gerona/60.2.165. J Gerontol A Biol Sci Med Sci. 2005. PMID: 15814857
-
Measures of brain morphology and infarction in the framingham heart study: establishing what is normal.Neurobiol Aging. 2005 Apr;26(4):491-510. doi: 10.1016/j.neurobiolaging.2004.05.004. Neurobiol Aging. 2005. PMID: 15653178
-
Gender differences in brain regional homogeneity of healthy subjects after normal sleep and after sleep deprivation: a resting-state fMRI study.Sleep Med. 2012 Jun;13(6):720-7. doi: 10.1016/j.sleep.2011.09.019. Epub 2012 Apr 13. Sleep Med. 2012. PMID: 22503940
-
Sex differences in brain aging: a quantitative magnetic resonance imaging study.Arch Neurol. 1998 Feb;55(2):169-79. doi: 10.1001/archneur.55.2.169. Arch Neurol. 1998. PMID: 9482358 Review.
Cited by
-
The Role of Race in Relations of Social Support to Hippocampal Volumes Among Older Adults.Res Aging. 2022 Feb;44(2):205-214. doi: 10.1177/01640275211017268. Epub 2021 May 12. Res Aging. 2022. PMID: 33977830 Free PMC article.
-
Age-specific characteristics and coupling of cerebral arterial inflow and cerebrospinal fluid dynamics.PLoS One. 2012;7(5):e37502. doi: 10.1371/journal.pone.0037502. Epub 2012 May 30. PLoS One. 2012. PMID: 22666360 Free PMC article.
-
Mechanisms underlying fatigue: a voxel-based morphometric study of chronic fatigue syndrome.BMC Neurol. 2004 Oct 4;4(1):14. doi: 10.1186/1471-2377-4-14. BMC Neurol. 2004. PMID: 15461817 Free PMC article.
-
Subdural hygroma and hemorrhagic conversion after microsurgical clipping for unruptured intracranial aneurysm.Acta Neurochir (Wien). 2023 May;165(5):1251-1260. doi: 10.1007/s00701-023-05555-0. Epub 2023 Mar 17. Acta Neurochir (Wien). 2023. PMID: 36930365 Review.
-
Morphological and hemispheric and sex differences of the anterior ascending ramus and the horizontal ascending ramus of the lateral sulcus.Brain Struct Funct. 2022 Jul;227(6):1949-1961. doi: 10.1007/s00429-022-02482-1. Epub 2022 Apr 20. Brain Struct Funct. 2022. PMID: 35441988 Free PMC article.
References
-
- Haug G. Age and sex dependence of the size of normal ventricles on computed tomography. Neuroradiology 1977;14:201-204 - PubMed
-
- Gyldensted C. Measurements of the normal ventricular system and hemispheric sulci of 100 adults with computed tomography. Neuroradiology 1977;14:183-192 - PubMed
-
- Meese W, Kluge W, Grumme T, Hopfenmüller W. CT evaluation of the CSF spaces of healthy persons. Neuroradiology 1980;19:131-136 - PubMed
-
- Yamaura H, Ito M, Kubota K, Matsuzawa T. Brain atrophy during aging: a quantitative study with computed tomography. J Gerontol 1980;35:492-498 - PubMed
Publication types
MeSH terms
LinkOut - more resources
Full Text Sources
Other Literature Sources
Medical