Clinical Trial
. 2000 Jan;21(1):183-93.

In vivo 1H MR spectroscopy of human head and neck lymph node metastasis and comparison with oxygen tension measurements

Affiliations
Clinical Trial

In vivo 1H MR spectroscopy of human head and neck lymph node metastasis and comparison with oxygen tension measurements

J M Star-Lack et al. AJNR Am J Neuroradiol. 2000 Jan.

Abstract

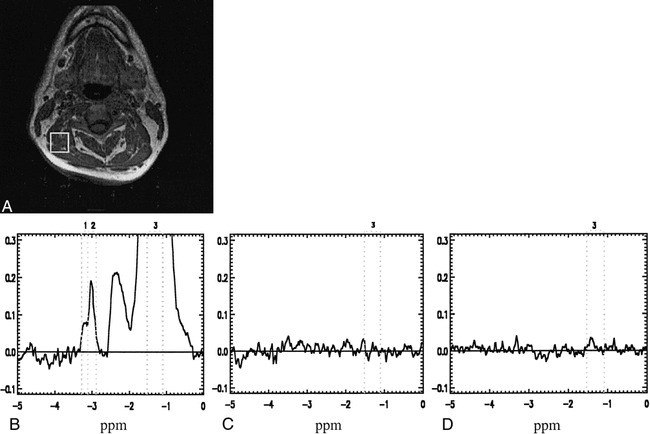
Background and purpose: Current diagnostic methods for head and neck metastasis are limited for monitoring recurrence and assessing oxygenation. 1H MR spectroscopy (1H MRS) provides a noninvasive means of determining the chemical composition of tissue and thus has a unique potential as a method for localizing and characterizing cancer. The purposes of this investigation were to measure 1H spectral intensities of total choline (Cho), creatine (Cr), and lactate (Lac) in vivo in human lymph node metastases of head and neck cancer for comparison with normal muscle tissue and to examine relationships between metabolite signal intensities and tissue oxygenation status.

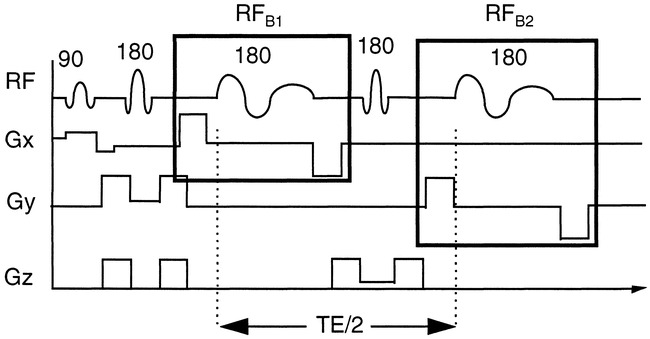
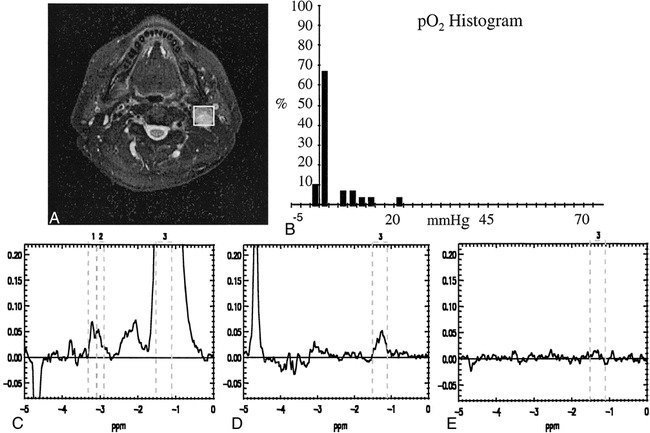
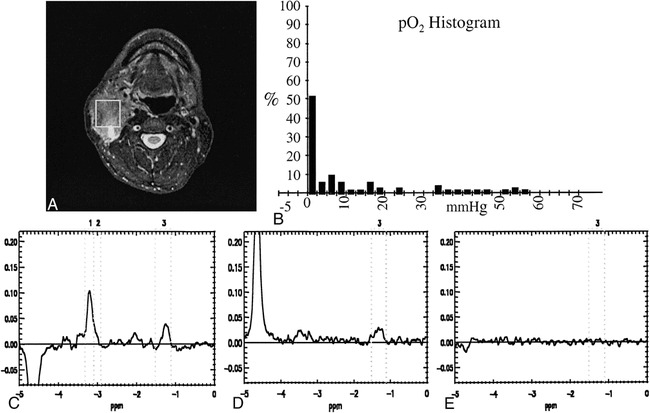
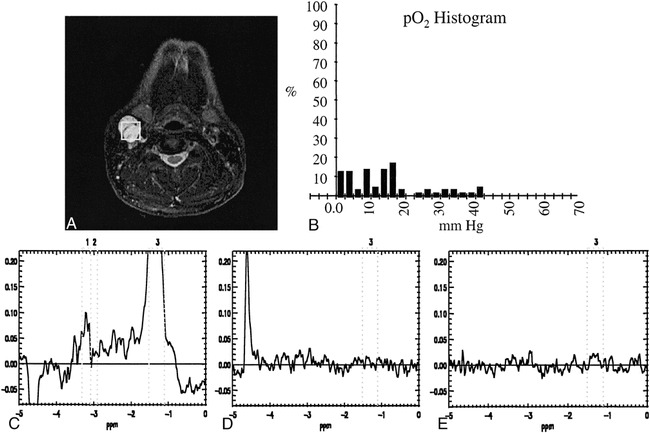
Methods: Volume-localized Lac-edited MRS at 1.5 T was performed in vivo on the lymph node metastases of 14 patients whose conditions were untreated and who had primary occurrences of squamous cell carcinoma. MRS measurements were acquired also from the neck muscle tissue of six healthy volunteers and a subset of the patients. Peak areas of Cho, Cr, and Lac were calculated. Tissue oxygenation (pO2) within the abnormal lymph nodes was measured independently using an Eppendorf polarographic oxygen electrode.

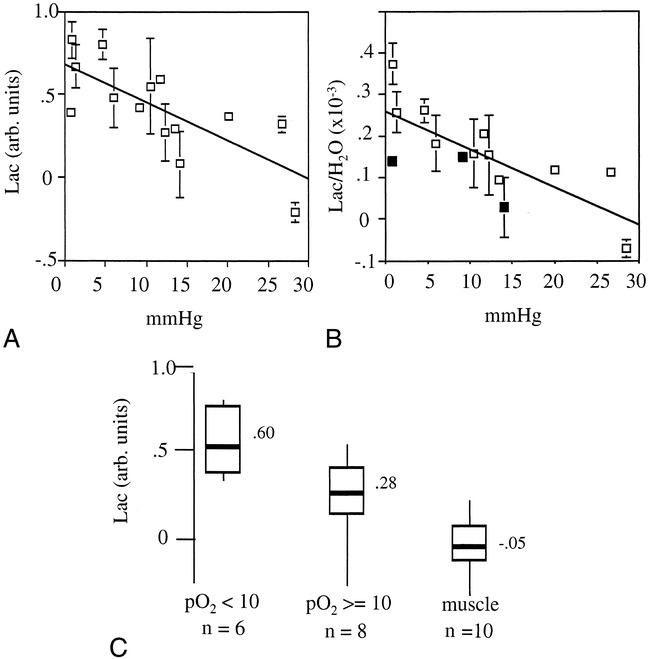
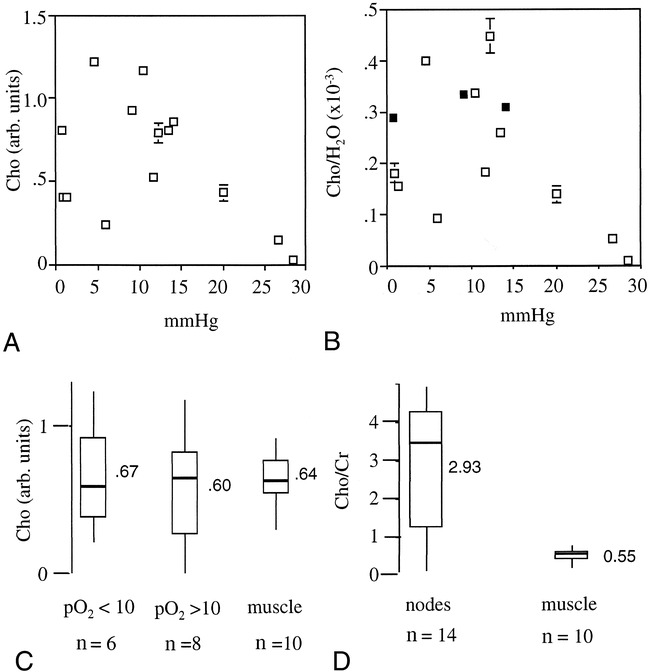
Results: Cho:Cr ratios were significantly higher in the nodes than in muscle tissue (node Cho:Cr = 2.9 +/- 1.6, muscle Cho:Cr = 0.55 +/- 0.21, P = .0006). Lac was significantly higher in cancer tissue than in muscle (P = .01) and, in the nodes, showed a moderately negative correlation with median pO2 (r = -.76) over a range of approximately 0 to 30 mm Hg. Nodes with oxygenation values less than 10 mm Hg had approximately twice the Lac signal intensity as did nodes with oxygenation values greater than 10 mm Hg (P = .01). Cho signal intensity was not well correlated with pO2 (r = -.46) but seemed to decrease at higher oxygenation levels (>20 mm Hg).

Conclusion: 1H MRS may be useful for differentiating metastatic head and neck cancer from normal muscular tissue and may allow for the possibility of assessing oxygenation. Potential clinical applications include the staging and monitoring of treatment.


Figures

<sc>fig</sc> 1.
fig 1.
Dual BASING with PRESS excitation. The two BASING pulses (RFB1 and RFB1) are separated in time by TE = 2 msec. For Cycle 1, the Lac methine quartet is included in the BASING inversion band, whereas for Cycle 2, the BASING center frequency is shifted downfield to exclude all metabolites of interest. The addition of Cycle 1 and Cycle 2 spectra yields the singlets, whereas the subtraction of Cycle 2 from Cycle 1 yields the Lac methyl doublet
<sc>fig</sc> 2.
fig 2.
Data from a representative hypoxic node in patient 7. A, T2-weighted image (3000/85/2) shows the location of the PRESS box. B, Histogram of oxygenation measurements. The median pO2 value is 1.3 mm Hg, which is very suggestive of hypoxia. C, Uncoupled (Cycle 1 + Cycle 2). D, Coupled (Cycle 1—Cycle 2). E, Error spectra acquired with MRS parameters of 2000/144/256. The Cho:Cr ratio is 1.3.
<sc>fig</sc> 3.
fig 3.
Data from a hypoxic node in patient 1. A, T2-weighted image (3000/85/2) shows the location of the PRESS box. B, Histogram of oxygen measurements. The median pO2 value is 0.7 mm Hg. C, Uncoupled (Cycle 1 + Cycle 2). D, Coupled (Cycle 1—Cycle 2). E, Error spectra acquired with MRS parameters of 2000/144/256. The Cho:Cr ratio is 4.3.
<sc>fig</sc> 4.
fig 4.
Data from a more aerobic node in patient 2. A, T2-weighted image (3000/85/2) shows the location of the PRESS box. B, Histogram of oxygen measurements. The median pO2 value is 14.1 mm Hg, which is more aerobic than the median values for patients 1 and 7. C, Uncoupled (Cycle 1 + Cycle 2). D, Coupled (Cycle 1—Cycle 2). E, Error spectra acquired with MRS parameters of 2000/144/256. The Cho:Cr ratio is 3.9.
<sc>fig</sc> 5.
fig 5.
Representative muscle spectrum. A, T1-weighted image (500/8/2) from a normal volunteer shows the location of the PRESS box enclosing muscle tissue. B, Uncoupled (Cycle 1 + Cycle 2). C, Coupled (Cycle 1—Cycle 2). D, Error spectra acquired with MRS parameters of 2000/144/256. The Cho:Cr ratio is 0.48, and the lipid suppression factor is greater than 3000.
<sc>fig</sc> 6.
fig 6.
Accumulated Lac measurements. A, Scatter plot of Lac SI versus pO2. The error bars are the SD after including the computed error signal (see fig 2C). A linear fit yielded a Pearson's correlation coefficient of −0.74. B, Scatter plot of Lac/H2O versus pO2. The Pearson's coefficient is −0.76. The average water signal was used for normalizing the three samples with darkened boxes. C, Box and whiskers plot for three data groups: pO2 < 10 mm Hg, pO2 ≥ 10 mm Hg, and muscle. All three groups are statistically different (P < 0.05). The mean values for each group are annotated (0.60, 0.28, −0.05). The boxes span the range of Lac signal intensities from the 25th to 75th percentiles. The bars within the boxes denote the median value, whereas the vertical lines (“whiskers”) are reflective of the data range.
<sc>fig</sc> 7.
fig 7.
Accumulated Cho and Cr measurements. A, Scatter plots of Cho SI versus pO2. B, Scatter plots of Cho/H2O SI versus pO2. The correlation coefficients are −0.43 and−0.45, respectively. The average water signal was used for normalizing the three samples darkened black boxes. C, Box and whiskers plots of Cho SI for three data groups: pO2 < 10 mm Hg, pO2 ≥ 10 mm Hg, and muscle. The mean Cho values are annotated, and the data were not statistically different. D, Box and whiskers plots of Cho:Cr ratios show statistically significant differentiation between muscle and cancer. The mean values are annotated.

Similar articles

Cited by

References

    1. Evanochko WT, Sakai TT, Ng TC, et al. NMR study of in vivo RIF-1 tumors: analysis of perchloric acid extracts and identification of 1H, 31P and 13C resonances. Biochim Biophys Acta 1984;805:104-116 - PubMed
    1. Langkowski JH, Wieland J, Bomsdorf H, et al. Pre-operative localized in vivo proton spectroscopy in cerebral tumors at 4.0 tesla: first results. Magn Reson Imaging 1989;7:547-555 - PubMed
    1. Alger JR, Frank JA, Bizzi A, et al. Metabolism of human glio-mas: assessment with H-1 MR spectroscopy and F-18 fluorodeoxyglucose PET (comment). Radiology 1990;177:633-641 - PubMed
    1. Bruhn H, Frahm J, Gyngell ML, et al. Noninvasive differentiation of tumors with use of localized H-1 MR spectroscopy in vivo: initial experience in patients with cerebral tumors. Radiology 1989;172:541-548 - PubMed
    1. Arnold DL, Shoubridge EA, Villemure JG, Feindel W. Proton and phosphorus magnetic resonance spectroscopy of human astrocytomas in vivo: preliminary observations on tumor grading. NMR Biomed 1990;3:184-189 - PubMed

Publication types