. 2000 Mar;20(5):1759-71.
doi: 10.1128/MCB.20.5.1759-1771.2000.

Sequential requirements of the N-terminal palmitoylation site and SH2 domain of Src family kinases in the initiation and progression of FcepsilonRI signaling

Affiliations

Sequential requirements of the N-terminal palmitoylation site and SH2 domain of Src family kinases in the initiation and progression of FcepsilonRI signaling

Z i Honda et al. Mol Cell Biol. 2000 Mar.

Abstract

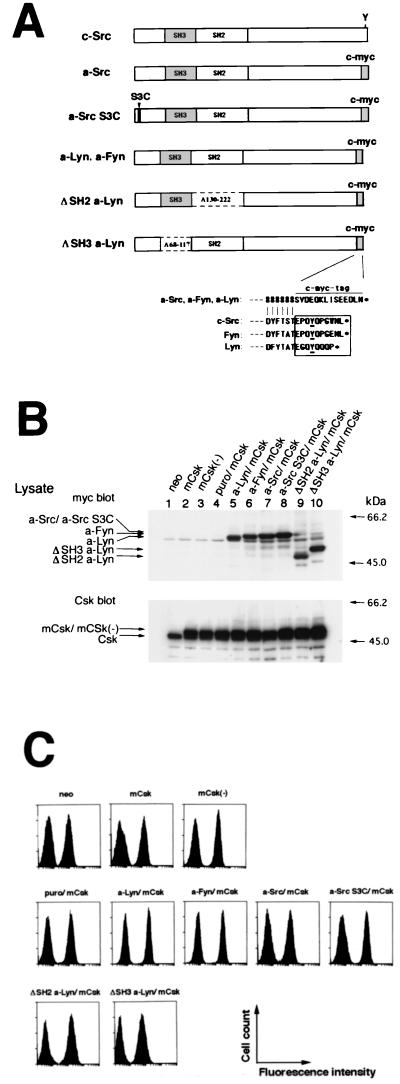
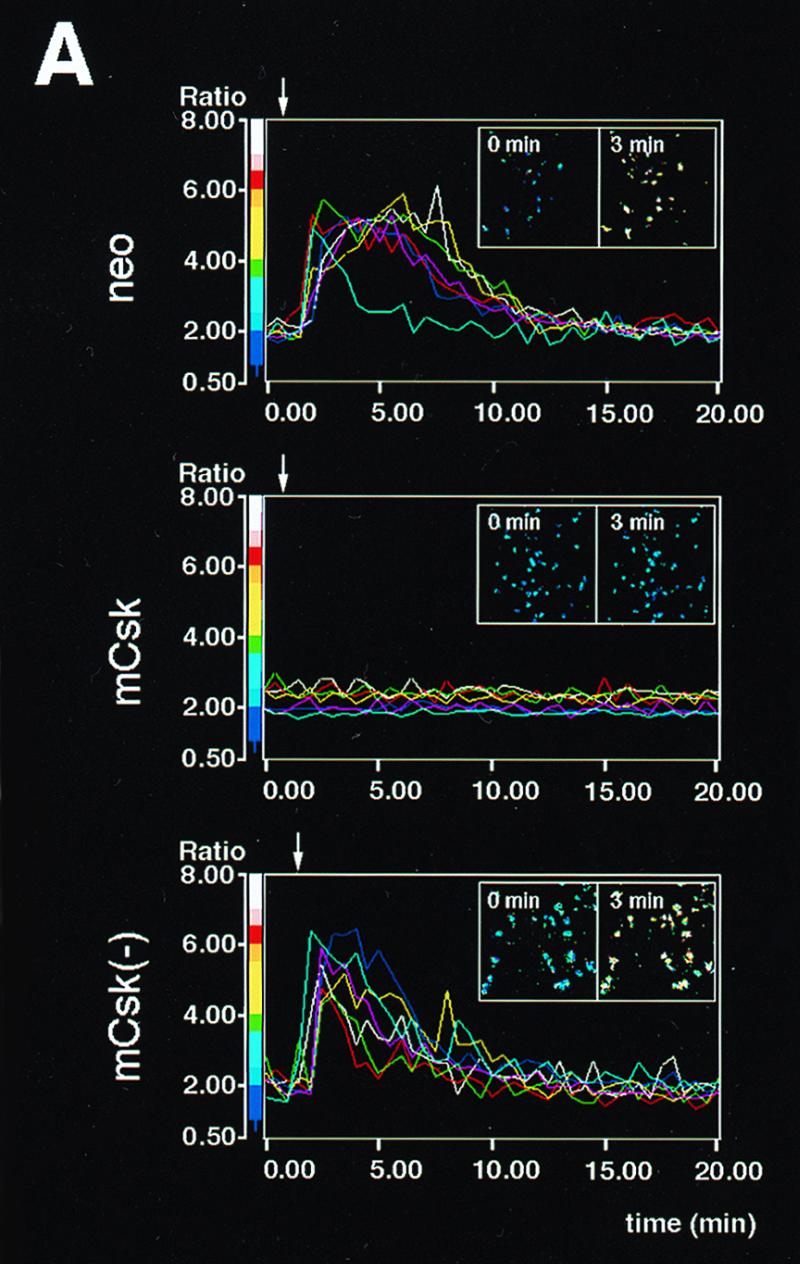
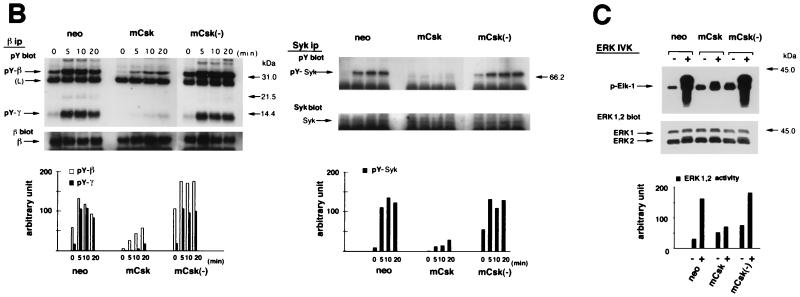
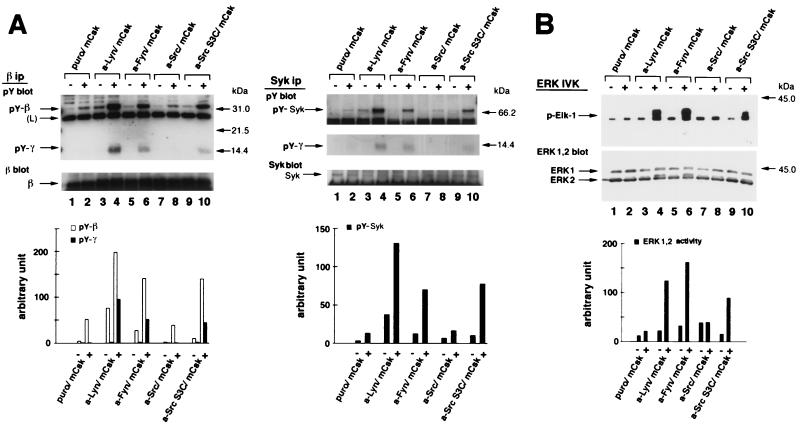
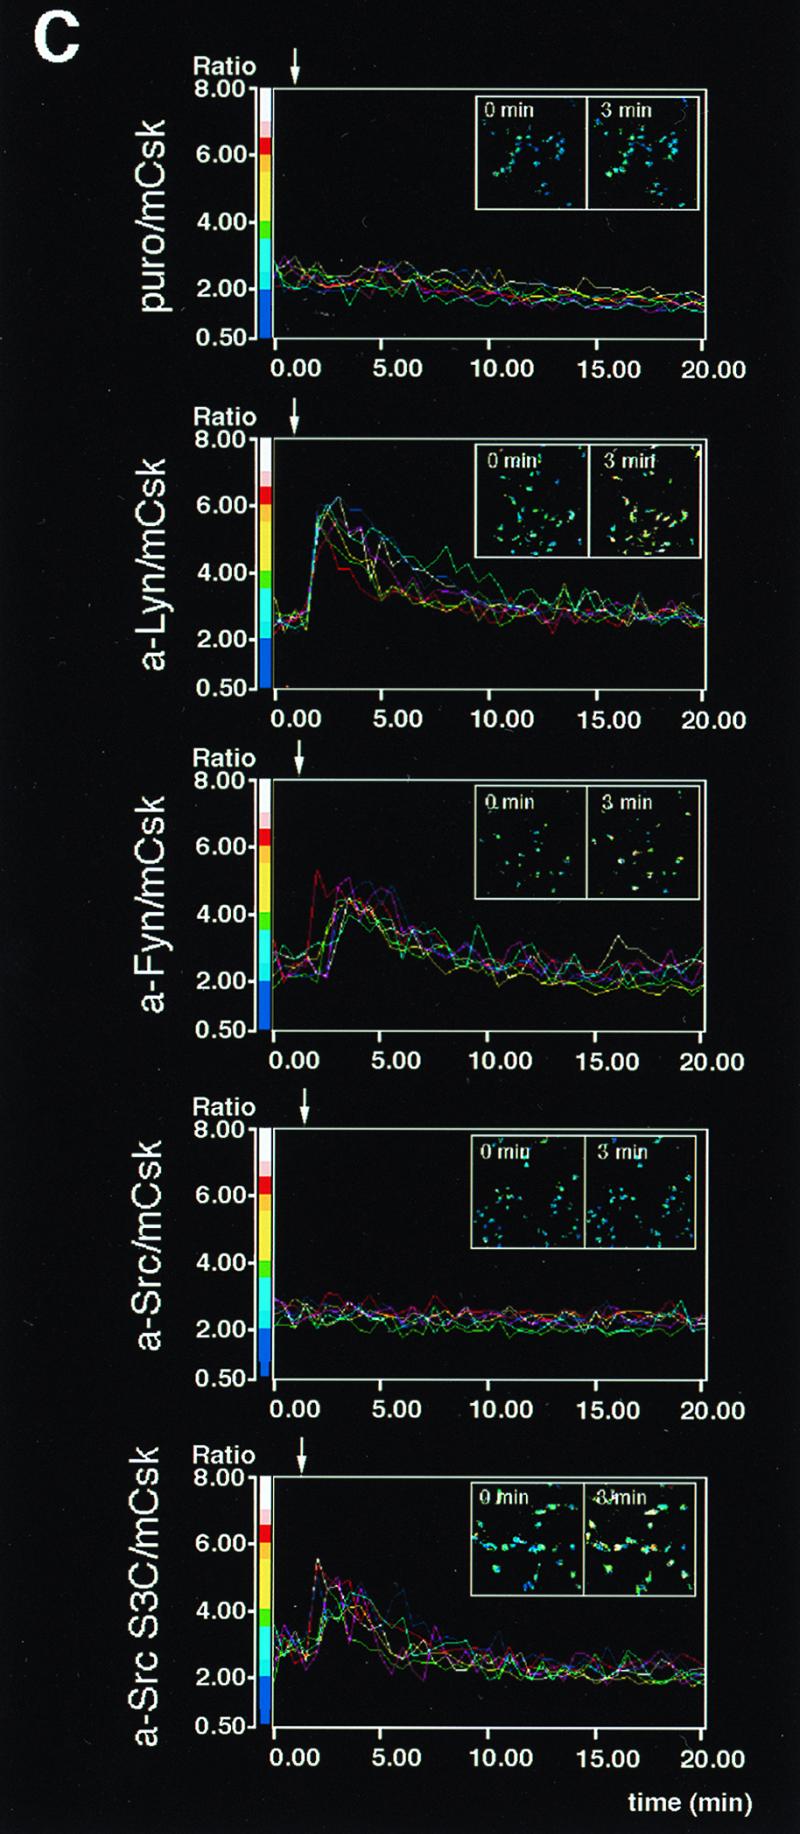
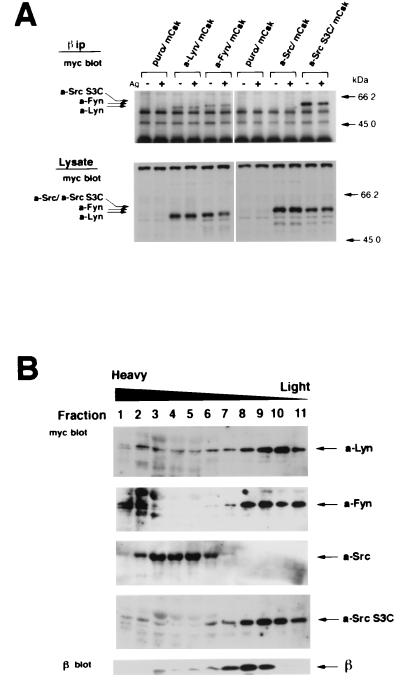
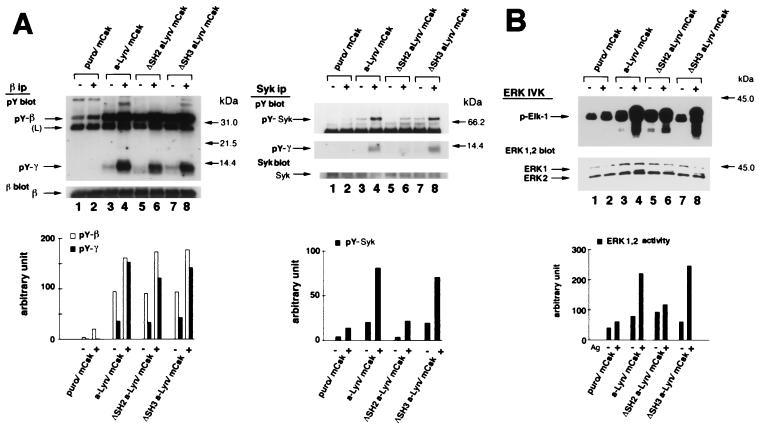
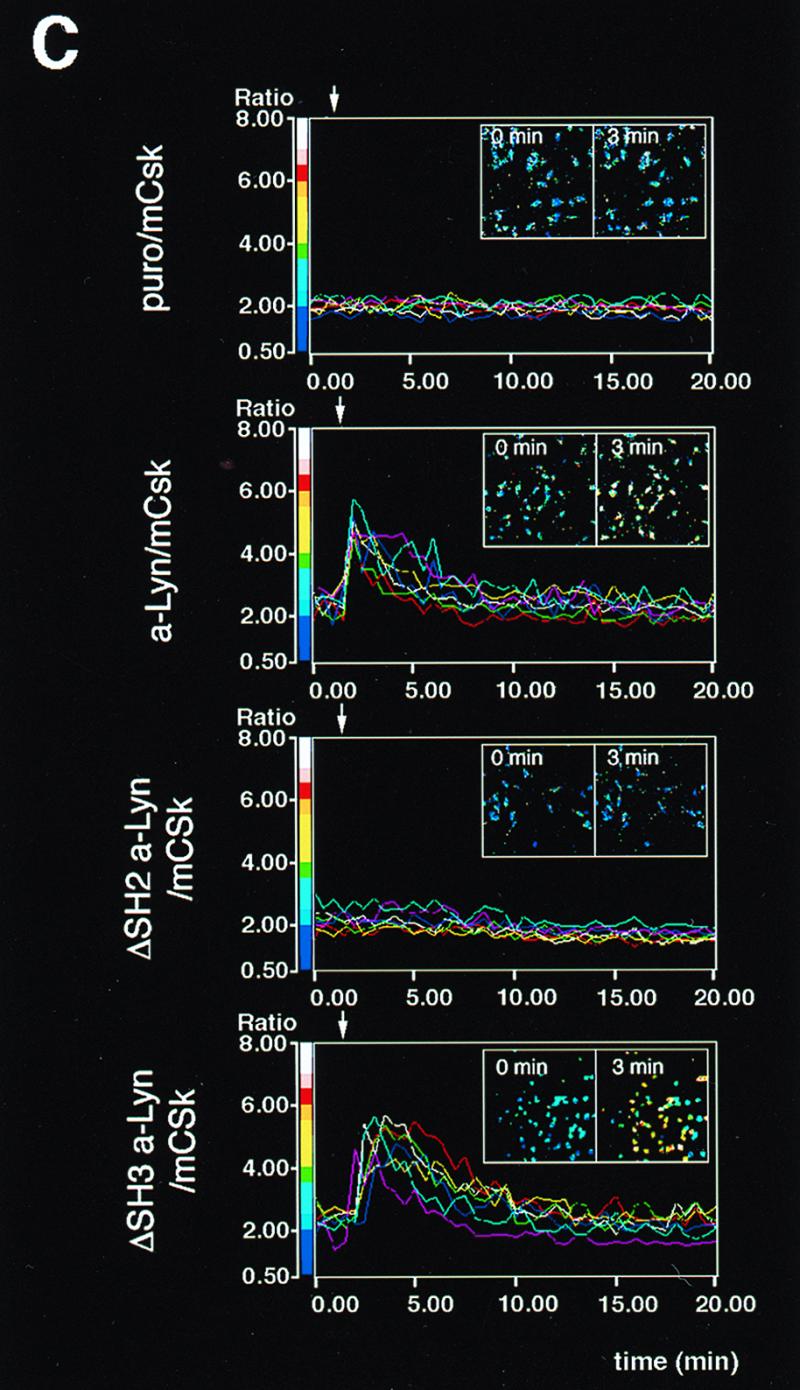
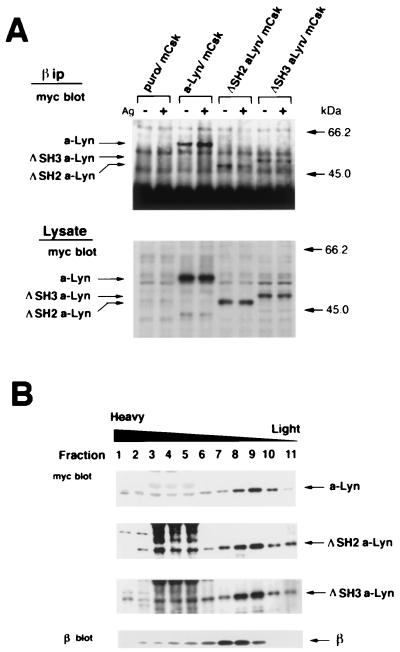
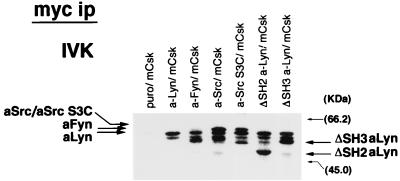
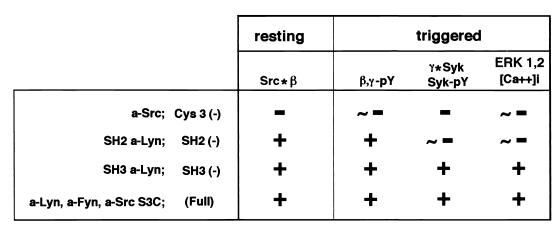
Initial biochemical signaling originating from high-affinity immunoglobulin E receptor (FcepsilonRI) has been ascribed to Src family kinases. To understand the mechanisms by which individual kinases drive the signaling, we conducted reconstitution experiments: FcepsilonRI signaling in RBL2H3 cells was first suppressed by a membrane-anchored, gain-of-function C-terminal Src kinase and then reconstructed with Src family kinases whose C-terminal negative regulatory sequence was replaced with a c-myc epitope. Those constructs derived from Lyn and Fyn, which are associated with detergent-resistant membranes (DRMs), physically interacted with resting FcepsilonRI and reconstructed clustering-induced signaling that leads to calcium mobilization and ERK1 and -2 activation. c-Src-derived construct, which was excluded from DRMs, failed to interact with FcepsilonRI and to restore the signaling, whereas creation of palmitoylatable Cys3 enabled it to interact with DRMs and with FcepsilonRI and to restore the signaling. Deletion of Src homology 3 (SH3) domain from the Lyn-derived construct did not alter its ability to transduce the series of signaling. Deletion of SH2 domain did not affect its association with DRMs and with FcepsilonRI nor clustering-induced tyrosine phosphorylation of FcepsilonRI beta and gamma subunits, but it almost abrogated the next step of tyrosine phosphorylation of Syk and its recruitment to FcepsilonRI. These findings suggest that Lyn and Fyn could, but c-Src could not, drive FcepsilonRI signaling and that N-terminal palmitoylation and SH2 domain are required in sequence for the initial interaction with FcepsilonRI and for the signal progression to the molecular assembly.


Figures

FIG. 1
FIG. 1
Creation of RBL2H3 cells expressing mCsk in combination with Src family kinases whose C-terminal sequences were replaced with a c-myc epitope. (A) Schematic representation of the constructs derived from c-Src, Lyn, and Fyn. To create C-terminal tyrosine-deleted, c-myc-tagged Src family kinases, the conserved 8 to 10 amino acids at the C termini of c-Src, p56lyn, and p59fyn (see boxed amino acids in the sequence alignment) containing negative regulatory tyrosine (underlined) were replaced with the c-myc epitope sequence. “#” indicates the identical amino acid to that of wild-type kinases. The mutated kinases derived from c-Src, p56lyn, and p59fyn were named a-Src, a-Lyn, and a-Fyn, respectively. In a-Src S3C, Ser3 in a-Src was replaced with Cys. ΔSH2 a-Lyn and ΔSH3 a-Lyn were created by deleting the SH2 (amino acids 130 to 222) and SH3 (amino acids 68 to 117) domains from a-Lyn, respectively. (B) Representative immunoblots of cell lines expressing mCsk, mCsk(−), or mCsk in combination with mutated Src family kinases. Cells were lysed with Triton X-100 solubilization buffer as described in Materials and Methods; 10 μg of protein at each lane was then separated by SDS-PAGE and subjected to immunoblots with anti-c-myc antibody (upper panel) to detect the mutated Src (a-Src) kinases and with anti-Csk antibody (lower panel). Cells expressing Neor control (lane 1), mCsk (lane 2), and a kinase-dead mCsk, mCsk(−) (lane 3) are shown. Cells expressing mCsk with Puror control (lane 4), a-Lyn (lane 5), a-Fyn (lane 6), a-Src (lane 7), a-Src S3C (lane 8), ΔSH2 a-Lyn (lane 9), and ΔSH3 a-Lyn (lane 10) are also shown. Migration positions of the expressed proteins are indicated on the left, and molecular mass markers are given on the right. (C) Analysis of surface expression of FcɛRI in the cell lines. Cells were sensitized or not (control) with mouse IgE and then stained with FITC-conjugated anti-mouse IgE. Surface fluorescence was analyzed by EPICS-XL flow cytometer. All of the cell lines exhibited levels of FcɛRI expression almost comparable to that of the neo control.
FIG. 2
FIG. 2
Influence of mCsk and mCsk(−) expression on FcɛRI-mediated early signaling. (A) Calcium mobilization in control cells (neo), mCsk-expressing cells (mCsk) and mCsk(−)-expressing cells [mCsk(−)]. Arrows indicate the time of antigen addition. The line graphs represent time courses of changes in [Ca2+]i in seven single cell areas randomly assigned. Insets represent pseudocolor images of [Ca2+]i at 0 min and at 3 min (2 min after antigen addition). Control neo cells rapidly responded to the antigen addition, and the signals subsided within 10 to 20 min. The mCsk subline exhibited almost negligible calcium response. Calcium signaling was preserved in mCsk(−) cells. (B) Time-dependent changes in tyrosine phosphorylation of FcɛRI β and γ subunits (left panel) and in Syk tyrosine phosphorylation (right panel). Cells were stimulated and solubilized at the indicated periods as described in Materials and Methods. In the analysis of β and γ tyrosine phosphorylation (left panel), FcɛRI was immunoprecipitated from cell lysates with anti-β monoclonal antibody (JRK) (denoted as β ip) and subjected to immunoblotting with 4G10 antiphosphotyrosine antibody (pY blot), and the membrane was reprobed with JRK (β blot). Migration positions of tyrosine phosphorylated β (pY-β) and g (pY-γ) subunit and reprobed β subunit (β) are indicated on the left. “(L)” represents the IgG light chain. Molecular mass markers are on the right. Films were scanned, and the intensity of the signal of tyrosine phosphorylated β (pY-β) and γ (pY-γ) were expressed as a bar graph (lower panel). In the control neo cells, pY-β was detectable before FcɛRI clustering and β and γ tyrosine phosphorylation increased, peaked within 5 min of stimulation, and then decreased. In mCsk cells, basal and clustering-induced signals were profoundly suppressed, while these were preserved in mCsk(−) cells. In the analysis of Syk tyrosine phosphorylation (right panel), Syk was immunoprecipitated with anti-Syk antibody (Syk ip), followed by immunoblotting with 4G10 (pY blot). The membrane was reprobed with anti-Syk antibody (Syk blot). Tyrosine-phosphorylated Syk (pY-Syk) and reprobed Syk (Syk) are indicated by arrows on the left. Molecular mass markers are on the right. Intensity of pY-Syk was shown as a bar graph (lower panel). Clustering-induced Syk tyrosine phosphorylation was clearly detectable in neo cells and was markedly suppressed in mCsk cells, whereas it was preserved in mCsk(−) cells. (C) ERK1 and -2 MAP kinase activation in neo, mCsk, and mCsk(−) cells. Cells were sensitized and lysed before (−) and 5 min after (+) FcɛRI clustering. ERK1 and -2 were immunoprecipitated and subjected to in vitro kinase assay (ERK IVK) by using Elk-1 as a substrate. Elk-1 phosphorylation was measured and visualized by using Fuji image analyzer BAS 2000. ERK1 and -2 content in total cell lysates (and mobility shift of ERK2) was analyzed by immunoblotting with anti-ERK1 and -2 antibody (ERK1, 2 blot). Positions of phosphorylated Elk-1 (p-Elk-1) and ERK1 and -2 are indicated by arrows on the left. Molecular mass markers are on the right. ERK1 and -2 activity was markedly increased after FcɛRI clustering in neo cells. mCsk expression suppressed it but mCsk(−) did not.
FIG. 2
FIG. 2
Influence of mCsk and mCsk(−) expression on FcɛRI-mediated early signaling. (A) Calcium mobilization in control cells (neo), mCsk-expressing cells (mCsk) and mCsk(−)-expressing cells [mCsk(−)]. Arrows indicate the time of antigen addition. The line graphs represent time courses of changes in [Ca2+]i in seven single cell areas randomly assigned. Insets represent pseudocolor images of [Ca2+]i at 0 min and at 3 min (2 min after antigen addition). Control neo cells rapidly responded to the antigen addition, and the signals subsided within 10 to 20 min. The mCsk subline exhibited almost negligible calcium response. Calcium signaling was preserved in mCsk(−) cells. (B) Time-dependent changes in tyrosine phosphorylation of FcɛRI β and γ subunits (left panel) and in Syk tyrosine phosphorylation (right panel). Cells were stimulated and solubilized at the indicated periods as described in Materials and Methods. In the analysis of β and γ tyrosine phosphorylation (left panel), FcɛRI was immunoprecipitated from cell lysates with anti-β monoclonal antibody (JRK) (denoted as β ip) and subjected to immunoblotting with 4G10 antiphosphotyrosine antibody (pY blot), and the membrane was reprobed with JRK (β blot). Migration positions of tyrosine phosphorylated β (pY-β) and g (pY-γ) subunit and reprobed β subunit (β) are indicated on the left. “(L)” represents the IgG light chain. Molecular mass markers are on the right. Films were scanned, and the intensity of the signal of tyrosine phosphorylated β (pY-β) and γ (pY-γ) were expressed as a bar graph (lower panel). In the control neo cells, pY-β was detectable before FcɛRI clustering and β and γ tyrosine phosphorylation increased, peaked within 5 min of stimulation, and then decreased. In mCsk cells, basal and clustering-induced signals were profoundly suppressed, while these were preserved in mCsk(−) cells. In the analysis of Syk tyrosine phosphorylation (right panel), Syk was immunoprecipitated with anti-Syk antibody (Syk ip), followed by immunoblotting with 4G10 (pY blot). The membrane was reprobed with anti-Syk antibody (Syk blot). Tyrosine-phosphorylated Syk (pY-Syk) and reprobed Syk (Syk) are indicated by arrows on the left. Molecular mass markers are on the right. Intensity of pY-Syk was shown as a bar graph (lower panel). Clustering-induced Syk tyrosine phosphorylation was clearly detectable in neo cells and was markedly suppressed in mCsk cells, whereas it was preserved in mCsk(−) cells. (C) ERK1 and -2 MAP kinase activation in neo, mCsk, and mCsk(−) cells. Cells were sensitized and lysed before (−) and 5 min after (+) FcɛRI clustering. ERK1 and -2 were immunoprecipitated and subjected to in vitro kinase assay (ERK IVK) by using Elk-1 as a substrate. Elk-1 phosphorylation was measured and visualized by using Fuji image analyzer BAS 2000. ERK1 and -2 content in total cell lysates (and mobility shift of ERK2) was analyzed by immunoblotting with anti-ERK1 and -2 antibody (ERK1, 2 blot). Positions of phosphorylated Elk-1 (p-Elk-1) and ERK1 and -2 are indicated by arrows on the left. Molecular mass markers are on the right. ERK1 and -2 activity was markedly increased after FcɛRI clustering in neo cells. mCsk expression suppressed it but mCsk(−) did not.
FIG. 3
FIG. 3
Differential abilities of a-Src kinases to restore FcɛRI signaling in mCsk cells. (A) Effects of the expression of a-Src kinases on FcɛRI β and γ tyrosine phosphorylation and Syk tyrosine phosphorylation. mCsk Cells transfected with Puror vector alone (Puro/mCsk) or with mCsk Cells stably expressing a-Lyn (a-Lyn/mCsk), a-Fyn (a-Fyn/mCsk), a-Src (a-Src/mCsk), or a-Src S3C (a-Src S3C/mCsk) were sensitized with IgE. Cells were lyzed before (−) or 5 min after FcɛRI clustering (+). Tyrosine phosphorylation of β and γ subunit and Syk was analyzed, and the data were expressed as described in the legends for Fig. 2B. Expression of a-Lyn, a-Fyn, and a-Src S3C enhanced tyrosine phosphorylation of β and γ subunit and Syk more than the Puro/mCsk control, but a-Src expression was ineffective. See the text for details. (B) ERK1 and -2 MAP kinase activation in mCsk cells coexpressing a-Src kinases. ERK1 and -2 activities before (−) and 5 min after (+) FcɛRI clustering were measured by in vitro kinase assay using Elk-1 as a substrate, as described in the legend for Fig. 2C. Clustering-induced ERK1 and -2 activation was clearly observed in a-Lyn/mCsk cells, a-Fyn/mCsk, and a-Src S3C/mCsk cells. Effects of FcɛRI clustering was only marginal in Puro/mCsk control cells and in a-Src/mCsk cells. (C) Calcium mobilization in mCsk cells coexpressing a-Src kinases. Single cell [Ca2+]i recording was conducted as described in Materials and Methods. See also the legend for Fig. 2A. FcɛRI-mediated calcium mobilization was restored by a-Lyn, a-Fyn, and a-Src S3C but not by a-Src. Data obtained from the functional analyses were reproducible in two independent cell lines.
FIG. 3
FIG. 3
Differential abilities of a-Src kinases to restore FcɛRI signaling in mCsk cells. (A) Effects of the expression of a-Src kinases on FcɛRI β and γ tyrosine phosphorylation and Syk tyrosine phosphorylation. mCsk Cells transfected with Puror vector alone (Puro/mCsk) or with mCsk Cells stably expressing a-Lyn (a-Lyn/mCsk), a-Fyn (a-Fyn/mCsk), a-Src (a-Src/mCsk), or a-Src S3C (a-Src S3C/mCsk) were sensitized with IgE. Cells were lyzed before (−) or 5 min after FcɛRI clustering (+). Tyrosine phosphorylation of β and γ subunit and Syk was analyzed, and the data were expressed as described in the legends for Fig. 2B. Expression of a-Lyn, a-Fyn, and a-Src S3C enhanced tyrosine phosphorylation of β and γ subunit and Syk more than the Puro/mCsk control, but a-Src expression was ineffective. See the text for details. (B) ERK1 and -2 MAP kinase activation in mCsk cells coexpressing a-Src kinases. ERK1 and -2 activities before (−) and 5 min after (+) FcɛRI clustering were measured by in vitro kinase assay using Elk-1 as a substrate, as described in the legend for Fig. 2C. Clustering-induced ERK1 and -2 activation was clearly observed in a-Lyn/mCsk cells, a-Fyn/mCsk, and a-Src S3C/mCsk cells. Effects of FcɛRI clustering was only marginal in Puro/mCsk control cells and in a-Src/mCsk cells. (C) Calcium mobilization in mCsk cells coexpressing a-Src kinases. Single cell [Ca2+]i recording was conducted as described in Materials and Methods. See also the legend for Fig. 2A. FcɛRI-mediated calcium mobilization was restored by a-Lyn, a-Fyn, and a-Src S3C but not by a-Src. Data obtained from the functional analyses were reproducible in two independent cell lines.
FIG. 4
FIG. 4
Coimmunoprecipitation of a-Src kinases with β subunit (A) and fractionation of a-Src kinases and β subunit by sucrose density gradient centrifugation (B). (A) mCsk cells transfected with Puror vector alone (Puro/mCsk) or mCsk cells stably expressing a-Lyn (a-Lyn/mCsk), a-Fyn (a-Fyn/mCsk), a-Src (a-Src/mCsk), or a-Src S3C (a-Src S3C/mCsk) were solubilized before (−) and 5 min after (+) FcɛRI clustering, and FcɛRI complex was immunoprecipitated with JRK anti-β monoclonal antibody. Immunoprecipitates (β ip) were subjected to immunoblotting with anti-c-myc antibody (myc blot) to detect a-Src kinases. Almost equal amounts of β subunits were recovered in the immunoprecipitates (not shown). An equal volume of aliquots of the total cell lysates (Lysate) was also analyzed by anti-c-myc immunoblotting (myc blot) to ascertain comparable solubilization of a-Src kinases. a-Lyn, a-Fyn, and a-Src S3C were detected in β immunoprecipitates before and after FcɛRI clustering, but a-Src was not detectable under either of the conditions. (B) Quiescent a-Src kinase-expressing mCsk cells were solubilized and subjected to discontinuous sucrose gradient ultracentrifugation as described in Materials and Methods. Protein was extracted and subjected to immunoblotting with anti-c-myc antibody (myc blot) or with JRK (β blot). a-Lyn, a-Fyn, and a-Src S3C possessing N-terminal palmitoylation signal were recovered at low-density fractions (fractions 8 to 11), and a-Src was recovered at high-density fractions (fractions 2 to 6). The β subunit was mainly found at intermediate fractions (fractions 7 to 9) and was codistributed with palmitoylatable a-Src kinases. The β immunoblotting was conducted by using a-Src/mCsk cells. Other cell lines exhibited almost identical β distributions (not shown).
FIG. 5
FIG. 5
Reconstruction of FcɛRI signaling by a-Lyn, ΔSH2 a-Lyn, or by ΔSH3 a-Lyn. (A) Effects of the expression of a-Lyn, ΔSH2 a-Lyn, or ΔSH3 a-Lyn on FcɛRI β and γ tyrosine phosphorylation and Syk tyrosine phosphorylation. Puro/mCsk cells, a-Lyn/mCsk cells, ΔSH2 a-Lyn/mCsk cells, and ΔSH3 a-Lyn/mCsk cells were lyzed before (−) and 5 min after FcɛRI clustering (+). Tyrosine phosphorylation of β and γ subunits and Syk was analyzed, and the data are expressed as described in the legend for Fig. 2B. Expression of ΔSH2 a-Lyn and ΔSH3 a-Lyn enhanced basal-β and clustering-induced β and γ tyrosine phosphorylation as effectively as a-Lyn did. a-Lyn and ΔSH3 a-Lyn clearly augmented Syk tyrosine phosphorylation above control levels in Puro/mCsk cells, whereas the effects of ΔSH2 a-Lyn were marginal. See the text for details. (B) ERK1 and -2 MAP kinase activation in mCsk cells coexpressing a-Lyn, ΔSH2 a-Lyn, or ΔSH3 a-Lyn. ERK1 and -2 activities before (−) and 5 min after (+) FcɛRI clustering were analyzed as described in the legend for Fig. 2C. Clustering-induced ERK1 and -2 activation was restored in a-Lyn/mCsk cells and in ΔSH3 a-Lyn/mCsk cells. In ΔSH2 a-Lyn/mCsk cells, FcɛRI-independent, basal kinase activity was increased above that in Puro/mCsk cells, but the clustering-induced increase was considerably smaller than in a-Lyn/mCsk cells and ΔSH3 a-Lyn/mCsk cells. See the text for details. (C) Calcium mobilization in mCsk cells expressing a-Lyn, ΔSH2 a-Lyn, or ΔSH3 a-Lyn. Data are expressed as described the legend for Fig. 2A. FcɛRI-mediated calcium mobilization was restored by a-Lyn and by ΔSH3 a-Lyn but not by ΔSH2 a-Lyn. Data obtained from the functional analyses were reproducible in two independent cell lines.
FIG. 5
FIG. 5
Reconstruction of FcɛRI signaling by a-Lyn, ΔSH2 a-Lyn, or by ΔSH3 a-Lyn. (A) Effects of the expression of a-Lyn, ΔSH2 a-Lyn, or ΔSH3 a-Lyn on FcɛRI β and γ tyrosine phosphorylation and Syk tyrosine phosphorylation. Puro/mCsk cells, a-Lyn/mCsk cells, ΔSH2 a-Lyn/mCsk cells, and ΔSH3 a-Lyn/mCsk cells were lyzed before (−) and 5 min after FcɛRI clustering (+). Tyrosine phosphorylation of β and γ subunits and Syk was analyzed, and the data are expressed as described in the legend for Fig. 2B. Expression of ΔSH2 a-Lyn and ΔSH3 a-Lyn enhanced basal-β and clustering-induced β and γ tyrosine phosphorylation as effectively as a-Lyn did. a-Lyn and ΔSH3 a-Lyn clearly augmented Syk tyrosine phosphorylation above control levels in Puro/mCsk cells, whereas the effects of ΔSH2 a-Lyn were marginal. See the text for details. (B) ERK1 and -2 MAP kinase activation in mCsk cells coexpressing a-Lyn, ΔSH2 a-Lyn, or ΔSH3 a-Lyn. ERK1 and -2 activities before (−) and 5 min after (+) FcɛRI clustering were analyzed as described in the legend for Fig. 2C. Clustering-induced ERK1 and -2 activation was restored in a-Lyn/mCsk cells and in ΔSH3 a-Lyn/mCsk cells. In ΔSH2 a-Lyn/mCsk cells, FcɛRI-independent, basal kinase activity was increased above that in Puro/mCsk cells, but the clustering-induced increase was considerably smaller than in a-Lyn/mCsk cells and ΔSH3 a-Lyn/mCsk cells. See the text for details. (C) Calcium mobilization in mCsk cells expressing a-Lyn, ΔSH2 a-Lyn, or ΔSH3 a-Lyn. Data are expressed as described the legend for Fig. 2A. FcɛRI-mediated calcium mobilization was restored by a-Lyn and by ΔSH3 a-Lyn but not by ΔSH2 a-Lyn. Data obtained from the functional analyses were reproducible in two independent cell lines.
FIG. 6
FIG. 6
Physical association of a-Lyn, ΔSH2 a-Lyn, or ΔSH3 a-Lyn with FcɛRI β subunit (A) and their distribution as analyzed by sucrose density gradient centrifugation (B). (A) Puro/mCsk cells, a-Lyn/mCsk cells, ΔSH2 a-Lyn/mCsk cells, and ΔSH3 a-Lyn/mCsk cells were solubilized before (−) and 5 min after (+) FcɛRI clustering and subjected to coimmunoprecipitation analysis by using JRK anti-β antibody as described in the legend for Fig. 4A. β Immunoprecipitates (β ip) were subjected to immunoblotting with anti-c-myc antibody (myc blot). Almost equal amounts of β subunits were recovered in the immunoprecipitates (not shown). An equal volume of aliquots of the total cell lysates (Lysate) was also analyzed by anti-c-myc immunoblotting (myc blot) to ascertain comparable solubilization efficiency. a-Lyn, ΔSH2 a-Lyn, or ΔSH3 a-Lyn were detected in β-immunoprecipitates before and after FcɛRI-clustering. (B) Quiescent a-Lyn/mCsk cells, ΔSH2 a-Lyn/mCsk cells, and ΔSH3 a-Lyn/mCsk cells were solubilized, and the distributions of a-Lyn-derived kinases and β subunit were analyzed by sucrose density gradient centrifugation, as described in the legend for Fig. 4B. a-Lyn, ΔSH2 a-Lyn, and ΔSH3 a-Lyn were found mainly at low-density fractions (fractions 7 to 11) and β subunit was mainly in the slightly higher density fractions (fractions 6 to 9) (see also Fig. 4B). The distribution of β subunit partly overlapped with those of a-Lyn-derived kinases. The β immunoblotting was conducted with a-Lyn/mCsk cells. Other cell lines exhibited almost identical β distributions (not shown).
FIG. 7
FIG. 7
In vitro kinase assay of a-Src kinases. Quiescent Puro/mCsk cells, a-Lyn/mCsk cells, a-Fyn/mCsk cells, a-Src/mCsk cells, a-Src S3C/mCsk cells, ΔSH2 a-Lyn/mCsk cells, and ΔSH3 a-Lyn/mCsk cells were solubilized, a-Src kinases were immunoprecipitated with anti-c-myc antibody, and autophosphorylation activities were assayed. Samples were separated by SDS-PAGE and analyzed by using a Fuji image analyzer BAS 2000. Expected migration positions of autophosphorylated a-Src kinase are indicated by arrows. Molecular mass markers are on the right. Kinase activity was not recovered from Puro/mCsk cell lysate. Phosphorylated proteins with molecular masses identical to those of a-Src kinases and other species were detected in the samples from a-Src kinase-expressing cells.
FIG. 8
FIG. 8
Relative abilities of a-Src kinases to restore the sequential signaling steps. “∗” and “-pY” denote physical interaction and tyrosine phosphorylation, respectively. [Ca2+]i and “ERK1, 2” indicate the increase in intracellular calcium concentration and ERK1 and -2 MAP kinase activation. See the text for details.

Similar articles

Cited by

References

    1. Alexandropoulos K, Cheng G, Baltimore D. Proline-rich sequences that bind to Src homology 3 domains with individual specificities. Proc Natl Acad Sci USA. 1995;92:3110–3114. - PMC - PubMed
    1. Amoui M, Draberova L, Tolar P, Draber P. Direct interaction of Syk and Lyn protein tyrosine kinases in rat basophilic leukemia cells activated via type I Fcɛ receptors. Eur J Immunol. 1997;27:321–328. - PubMed
    1. Aoki Y, Kim Y T, Stillwell R, Kim T J, Pillai S. The SH2 domains of Src family kinases associate with Syk. J Biol Chem. 1995;270:15658–15663. - PubMed
    1. Beaven M A, Metzger H. Signal transduction by Fc receptors: the FcɛRI case. Immunol Today. 1993;14:222–226. - PubMed
    1. Benhamou M, Ryba N J, Kihara H, Nishikata H, Siraganian R P. Protein-tyrosine kinase p72syk in high affinity IgE receptor signaling. Identification as a component of pp72 and association with the receptor γ chain after receptor aggregation. J Biol Chem. 1993;268:23318–23324. - PubMed

Publication types

LinkOut - more resources