. 2000 Mar;20(5):1797-815.
doi: 10.1128/MCB.20.5.1797-1815.2000.

Arrest of G(1)-S progression by the p53-inducible gene PC3 is Rb dependent and relies on the inhibition of cyclin D1 transcription

Affiliations

Arrest of G(1)-S progression by the p53-inducible gene PC3 is Rb dependent and relies on the inhibition of cyclin D1 transcription

D Guardavaccaro et al. Mol Cell Biol. 2000 Mar.

Abstract

The p53-inducible gene PC3 (TIS21, BTG2) is endowed with antiproliferative activity. Here we report that expression of PC3 in cycling cells induced accumulation of hypophosphorylated, growth-inhibitory forms of pRb and led to G(1) arrest. This latter was not observed in cells with genetic disruption of the Rb gene, indicating that the PC3-mediated G(1) arrest was Rb dependent. Furthermore, (i) the arrest of G(1)-S transition exerted by PC3 was completely rescued by coexpression of cyclin D1 but not by that of cyclin A or E; (ii) expression of PC3 caused a significant down-regulation of cyclin D1 protein levels, also in Rb-defective cells, accompanied by inhibition of CDK4 activity in vivo; and (iii) the removal from the PC3 molecule of residues 50 to 68, a conserved domain of the PC3/BTG/Tob gene family, which we term GR, led to a loss of the inhibition of proliferation as well as of the down-regulation of cyclin D1 levels. These data point to cyclin D1 down-regulation as the main factor responsible for the growth inhibition by PC3. Such an effect was associated with a decrease of cyclin D1 transcript and of cyclin D1 promoter activity, whereas no effect of PC3 was observed on cyclin D1 protein stability. Taken together, these findings indicate that PC3 impairs G(1)-S transition by inhibiting pRb function in consequence of a reduction of cyclin D1 levels and that PC3 acts, either directly or indirectly, as a transcriptional regulator of cyclin D1.


Figures
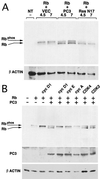
FIG. 1
FIG. 1
Induction of pRb dephosphorylation by PC3 and its reversal by cyclins. (A) Ectopic expression of PC3 leads to dephosphorylation of pRb. NIH 3T3 cells (1.3 × 10⁵) were seeded onto 60-mm-diameter dishes. After 24 h, cells were transfected with the human Rb expression plasmid pCMVpRb (4.5 μg) together with the pSCT (VEC), pSCT-PC3 (PC3), or pRSVRasAsn17 (Ras N17) expression vector (4.5 μg each), as indicated. Control cells without transfected plasmids were also analyzed (NT). After 60 h, cells were lysed in Laemmli buffer and pRb was detected by Western blotting using the G3-245 monoclonal antibody. (B) Reversal by cyclins of the PC3-mediated pRb dephosphorylation. NIH 3T3 cells (1.3 × 10⁵) were seeded onto 60-mm-diameter dishes. After 24 h, cells were transfected with pCMVpRb (4.5 μg) together with expression vectors for PC3, cyclins, or cyclin-dependent kinases (4.5 μg each), as indicated. In transfections where Rb or PC3 expression constructs were absent, a corresponding amount of the empty vectors (4.5 μg of each) was used. Equal amounts of cell lysates were analyzed for pRb and PC3 expression by immunoblotting. Protein loading was verified by β-actin detection.
FIG. 2
FIG. 2
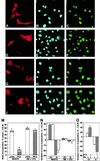
Rb-dependent inhibition of S-phase entry by PC3. (A to L) Representative immunofluorescence photomicrographs of BrdU incorporation in NIH 3T3 (A to F) and Rb−/− (G to L) cells transfected with PC3. NIH 3T3 and Rb−/− 3T3 cells (0.8 × 10⁵) were seeded onto coverslips in 35-mm-diameter dishes. After 24 h, cells were transfected with the expression vector pSCT-β-Gal or pSCT-PC3 (1.5 μg each). DNA synthesis assays were performed by adding 50 μM BrdU to the culture medium 40 h after transfection. After 18 to 20 h, cells were fixed, permeabilized, and stained. β-Gal and PC3 proteins were revealed using anti-β-Gal (A and G) or anti-PC3 (i.e., A3H [D and J]) polyclonal antibodies followed by incubation with goat anti-rabbit TRITC-conjugated antibody. BrdU was visualized by anti-BrdU monoclonal antibody (corresponding photomicrographs C, F, I, and L) followed by goat anti-mouse FITC-conjugated antibody. Nuclei were detected by Hoechst 33258 dye (corresponding photomicrographs B, E, H, and K). Arrows indicate the positions of nuclei that did not incorporate BrdU. Bar, 30 μm. (M) Percentage of BrdU-incorporating cells (NIH 3T3 or Rb−/− 3T3, as indicated) after transfection with pSCT-PC3 (filled bars) or control pSCT-β-Gal (open bars). Values are calculated as the percentages of cells positive for BrdU, detected between cells positive for β-Gal and those positive for PC3, whose total number within each experiment was assumed to be 100%. Means ± SEM are from three independent experiments (a representative field is shown in A to L). The number of cells counted for each group is indicated at the top of each bar. ∗, P = 0.0000 versus any other group (Student's t test). (N) Flow cytometry analysis of PC3 (filled bars) or p16 (open bars) effects on cell cycle profile in NIH 3T3 and Rb−/− 3T3 cells. NIH 3T3 or Rb−/− 3T3 cells (3 × 10⁵) were seeded onto 90-mm-diameter culture dishes; after 24 h, cells were transfected either with the pSCT empty plasmid (8.5 μg), with pSCT-PC3 (8.5 μg), or with pXp16 plasmid (8.5 μg), together with a plasmid encoding the CD20 cell surface marker (pCMVCD20, 3 μg). After 60 h, transfected cells were identified by staining with an FITC-conjugated anti-CD20 antibody, and their cell cycle distribution was measured by analyzing the DNA content after staining with propidium iodide, using two-color flow cytometry. Data from three independent experiments are shown as means ± SEM of the changes in the percentages of cells in G0/G1 or S cycle phase, compared to the corresponding value of the control transfection with the empty vector pSCT. (O) Effects of PC3 on cell cycle profile of Rb−/− 3T3 cells upon readdition of Rb. Rb−/− 3T3 cells were transfected with pCMVpRb (0.5 μg) or its empty vector. To each of these two treatments was added either pSCT-PC3 (7.5 μg, filled bars) or the pSCT empty plasmid (7.5 μg, open bars). The plasmid encoding the CD20 cell surface marker (pCMVCD20, 3 μg) was used in all transfections. Shown are the changes in the percentages of cells in G0/G1 or S cycle phase induced by addition of pRb (compared for each group to the corresponding value of the control transfection in the absence of pRb), with or without PC3 as indicated. Data are means ± SEM from three independent experiments.
FIG. 3
FIG. 3
Expression of cyclin D1 rescues the PC3-dependent G1 arrest. NIH 3T3 cells (0.8 × 10⁵) were seeded onto 35-mm-diameter dishes. After 24 h, cells were transfected with the expression vector pSCT-PC3 (PC3, 0.4 μg, filled bars) or pSCT-β-Gal (GAL, 0.4 μg, open bars), together with the indicated cyclins (0.8 μg) and CDKs (0.8 μg). In transfections where the CDK or the cyclin was absent, a corresponding amount (0.8 μg) of the empty CMV vector was cotransfected. Detection of transfected cells expressing PC3 or β-Gal and analysis of their DNA synthesis by measuring BrdU incorporation were performed as described in the Fig. 2A legend. At least 90 cells were scored for each experiment. The results are means ± SEM of at least three independent experiments. ∗∗∗, P = 0.0000 versus GAL; ∗∗, P < 0.0001 versus GAL; ∗, P < 0.001 versus GAL; N.S., P > 0.05 versus GAL (Student's t test).
FIG. 4
FIG. 4
Inhibition of cyclin D1 expression by PC3 in NIH 3T3 and Rb−/− cells. NIH 3T3 and Rb−/− 3T3 cells (3 × 10⁵) were seeded onto 90-mm-diameter culture dishes. After 24 h, cells were transfected with either pSCT empty plasmid (VEC; 21 μg for each dish, total of seven dishes for each cell line) or pSCT-PC3 (21 μg for each dish, total of seven dishes for each cell line), together with a plasmid encoding the CD20 cell surface marker (pCMVCD20, 3 μg). Sixty hours after, extracts from transfected cells isolated by CD20-specific cell sorting were subjected to immunoblotting with antibodies specific for the cyclin and CDK proteins indicated.
FIG. 5
FIG. 5
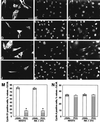
Inhibition of cyclin D1 nuclear immunofluorescence staining by ectopic PC3 in NIH 3T3 and Rb−/− cells. (A to L) Representative immunofluorescence photomicrographs of cyclin D1 expression in NIH 3T3 (A to F) and Rb−/− 3T3 (G to L) cells transfected with PC3 (or control β-Gal). NIH 3T3 or Rb−/− 3T3 cells (0.8 × 10⁵) were seeded onto coverslips in 35-mm-diameter dishes and transfected with the expression vector pSCT-β-Gal or pSCT-PC3 (1.5 μg each). After 60 h, cells were fixed, permeabilized, and stained. β-Gal and PC3 proteins were detected with anti-β-Gal (A and G) or anti-PC3 (D and J) polyclonal antibodies, followed by goat anti-rabbit TRITC-conjugated antibody. Nuclei were stained by Hoechst 33258 dye (corresponding photomicrographs B, H, E, and K). Cyclin D1 was visualized by anti-cyclin D1 mouse monoclonal antibody, followed by goat anti-mouse FITC-conjugated antibody (corresponding photomicrographs C, I, F, and L). Arrows indicate the positions of nuclei negative for cyclin D1 staining. Bar, 40 μm. (M) Percentage of NIH 3T3 and Rb−/− 3T3 cells positive for cyclin D1 immunofluorescence staining after transfection with pSCT-β-Gal (open bars) or pSCT-PC3 (filled bars). Values are calculated as the percentages of cells positive for cyclin D1 nuclear staining, detected between cells positive for β-Gal and those positive for PC3, whose total number within each experiment was assumed to be 100%. Means ± SEM of three independent experiments, performed as described above for panels A to L, which are a representative field, are shown. ∗, P = 0.0000 versus the corresponding control (Student's t test). The number of cells counted for each group is indicated at the top of each bar. (N) Percentage of cyclin A-positive cells by immunofluorescence staining after transfection with pSCT-β-Gal (open bars) or pSCT-PC3 (filled bars). Transfection and detection of PC3 and β-Gal were performed as described for panels A to L. However, in order to distinguish the reactivity to the rabbit polyclonal anti-cyclin A antibody from that to either anti-PC3 (A3H) or anti-β-Gal (all rabbit polyclonal antibodies), cells were incubated first with anti-cyclin A and then with a mouse anti-rabbit antibody, washed, and fixed. Incubation with A3H (or anti-β-Gal) followed. Anti-cyclin A and anti-PC3 (or anti-β-Gal) antibodies were detected by goat anti-mouse FITC-conjugated and goat anti-rabbit TRITC-conjugated antibodies, respectively. Values are the means ± SEM of three independent experiments. The number of cells counted for each group is indicated at the top of each bar.
FIG. 6
FIG. 6
Inhibition of cyclin D1 transcription by PC3. (A) Inhibition of cyclin D1 mRNA levels in NIH 3T3 and Rb−/− 3T3 cells by PC3. Cells (3 × 10⁵) were seeded onto 90-mm-diameter culture dishes and transfected with either pSCT empty plasmid or pSCT-PC3 (21 μg each) together with a plasmid encoding the CD20 cell surface marker (pCMVCD20, 3 μg), as described for Fig. 4. Sixty hours after, cells were isolated by CD20-specific cell sorting (obtaining 3 × 10⁵ to 5 × 10⁵ cells), and total RNA was extracted. The specific mRNA species indicated were visualized by RT-PCR analysis using specific primers. Equal amounts of RT-PCR products amplified from NIH 3T3 or Rb−/− 3T3 sorted cells, transfected with either pSCT-PC3 or the empty vector, were electrophoresed, blotted on a filter, and hybridized to probes for cyclins A, E, and D1; PC3; and β-actin. RT “+” or “−” indicates the products of amplification performed in parallel on two aliquots of each RNA starting sample preincubated or not with RT, respectively, in order to check the presence of DNA contamination. Control amplifications using as template the cDNA corresponding to each mRNA species gave a signal of the expected size (data not shown). (B) Relative levels of the mRNAs, as means ± SEM of three independent experiments, of which a representative one is shown in panel A. Values were obtained by measuring Southern blot densities of the PCR product of each experiment with a PhosphorImager system and were represented as ratios of the density observed in pC3-transfected cells to the corresponding one in pCST-transfected cells (assumed to be 1; see control bars). Values were then corrected for the corresponding β-actin relative expression, according to the following formula: relative sample density = sample density in PC3-transfected cells × 100/sample density in vector-transfected cells/(β-actin density in PC3-transfected cells × 100/β-actin density in vector-transfected cells). Black bars, NIH 3T3 cells; grey bars, Rb−/− 3T3 cells. (C) Inhibitory effect of PC3 on cyclin D1 promoter activity. NIH 3T3 cells (105) seeded onto 35-mm-diameter culture dishes were transfected after 24 h with either pSCT-PC3 or CMV–E2F-1 or the corresponding empty plasmids. Forty-eight hours after transfections, cell lysates were collected and assayed for luciferase activity. The fold decrease in luciferase activity was calculated relative to the level of control samples (transfected with the empty vectors), which were set to the unit. The bars represent the average fold activities ± SEM of three independent experiments performed in duplicate. The luciferase activities were measured in luciferase units per microgram of protein normalized to the amount of plasmid DNA present in each extract (black or grey bars). The ratio of transfected expression vector to reporter plasmid is shown on the abscissa. The amount of reporter used was 0.5 μg, while the highest amount of pSCT-PC3 and CMV–E2F-1 was 1.5 μg (corresponding to a molar ratio of expression vector to reporter of 4.5 and 3.0, respectively).
FIG. 7
FIG. 7
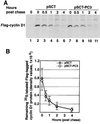
The half-life of Flag-tagged cyclin D1 protein is not changed by PC3. (A) Forty-five hours after cotransfection of NIH 3T3 cultures (2.3 × 10⁵ cells in 60-mm-diameter dishes) with Flag-tagged cyclin D1 (2.15 μg) and either pSCT-β-Gal or pSCT-PC3 (2.15 μg each), cells were metabolically labeled for 2 h with [35S]methionine. Cells were washed with medium containing an excess of unlabeled methionine, collected, and lysed at the indicated times. Cell lysates containing equal amounts of proteins were then immunoprecipitated using the M2 monoclonal antibody against the Flag epitope. A control transfected with pSCT vector without Flag-tagged cyclin D1 is shown in lane 1. Shown are results of a representative experiment. (B) Graphic representation of Flag-tagged cyclin D1 expression. The data at individual time points are the amounts of 35S-labeled Flag-tagged cyclin D1 protein as measured by a PhosphorImager system and are the means ± SEM of four independent experiments. The half-lives of Flag-tagged cyclin D1 protein were calculated for each experiment by linear regression analysis of the density values at the different time points, transformed by common logarithm.
FIG. 8
FIG. 8
Effects of the ectopic expression of wild-type and mutant PC3 constructs on cell growth arrest and cyclin D1 expression. (A) Schematic representation of PC3 mutants; the hatched boxes inside the PC3 sequence represent the regions conserved among the different members of the PC3 family. (B, C, and D) NIH 3T3 cells were transfected with the indicated pSCT-PC3 construct (either wild type or mutant; 3.8 μg) or with the empty vector pSCT (3.8 μg). The vector carrying the neomycin resistance gene (pcDNA3, 0.5 μg) was included in each transfection. The transfected cultures were then split into three fractions 48 h after transfection, two for the colony formation assay (2 × 10⁵ and 1 × 10⁵ cells [B]) and a second (6 × 10⁵ cells) for protein expression analysis by Western blotting (C and D). (B) For the colony formation assay, the colonies resistant to G418 after 2 weeks of selection, arising from each transfected construct, were counted and expressed as percentages of the number of resistant colonies formed by transfection of the empty vector. Calculations are means ± SEM from four independent experiments. VEC, vector-cotransfected cells, considered 100% of colony formation. ∗, P < 0.05 versus VEC control group (Student's t test); ∗∗, P < 0.01 versus VEC control group (Student's t test). (C and D) Equal amounts of cell lysates were used for Western blot analysis; (C) representative experiment analyzing the PC3 and β-actin protein levels; (D) means ± SEM of protein expression levels as judged by densitometry analysis of the four independent experiments, after normalization to the corresponding β-actin expression level (unity = the expression of PC3 wild-type protein for each experiment). (E) Immunofluorescence photomicrographs showing NIH 3T3 cells expressing either wild-type or mutated PC3, as indicated. Detection was done by the anti-PC3 antibody. The lower panels show nuclear staining, using Hoechst 33258 dye. Bar, 25 μm. (F) Percentage of NIH 3T3 cells positive for cyclin D1 immunofluorescence staining after transfection with pSCT-β-Gal, pSCT-PC3, pSCT-PC3 Δ50–68, pSCT-PC3 Δ105–123, or pSCT-S147N mutants (1.5 μg each). Transfections, as well as detection of proteins (PC3 [wild type and mutated], β-Gal, and cyclin D1), were performed as described for Fig. 5A to L. Values are the means ± SEM of four independent experiments. ∗, P < 0.05 versus β-Gal control group (Student's t test); N.S., P > 0.05 versus β-Gal control group (Student's t test). The number of cells counted for each group is indicated at the top of each bar. w.t. and W.T., wild type.
FIG. 9
FIG. 9
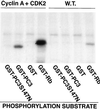
Phosphorylation of PC3 at aa 147 by cyclin A-CDK2. Lysates of Sf9 cells coinfected with either CDK2 and cyclin A or wild-type baculovirus lysates were assayed in 20-μl reaction mixtures for GST-PC3 S147N, GST-PC3, GST, or GST-Rb phosphorylation by measuring incorporation of 32P. Samples were analyzed by SDS-PAGE. Shown is the autoradiograph from the area of the gel containing the substrate proteins. W.T., wild type.
FIG. 10
FIG. 10
Assessment of the inhibition of G1-S progression by PC3 in cyclin D1−/− cells. About 0.8 × 10⁵ cyclin D1+/+ and cyclin D1−/− MEF cells were seeded onto coverslips in 35-mm-diameter dishes and transfected after 24 h with the expression vector pSCT-β-Gal or pSCT-PC3 (1.5 μg each). DNA synthesis assays were performed by adding 50 μM BrdU to the culture medium 36 h after transfection. After 24 h, cells were fixed, permeabilized, and stained. β-Gal and PC3 proteins were revealed with the polyclonal antibodies anti-β-Gal and anti-PC3, respectively, followed by goat anti-rabbit TRITC-conjugated antibody, whereas BrdU was visualized by anti-BrdU monoclonal antibody followed by goat anti-mouse FITC-conjugated antibody, as described for Fig. 2. The percentages of BrdU-incorporating cells shown are means ± SEM of three independent experiments. The number of cells counted for each group is indicated at the top of each bar. ∗, P < 0.001 versus control group (Student's t test).
FIG. 11
FIG. 11
Effect of PC3 on the protein kinase activities of cyclins-CDKs in vivo. (A) Characterization by Western blotting of NIH 3T3 cultures infected with retrovirus carrying the PC3 coding region or with empty vector (from supernatants of BOSC23 cells transfected with the pBABE puro-PC3 or pBABE puro vector, respectively). Equal amounts of proteins were loaded. (B) In vivo activity of CDK2 and CDK4 in NIH 3T3 cells infected with the PC3 retrovirus or with the empty retrovirus, as indicated. Equal amounts of proteins, from NIH 3T3 lysates of cultures infected with PC3 retrovirus or empty retrovirus, were immunoprecipitated with normal rabbit serum (NRS) or with anti-CDK2 and anti-CDK4 antibodies and then assayed for GST-Rb phosphorylation in 50-μl reaction mixtures by measuring incorporation of 32P. Samples were loaded in SDS-PAGE gels and transferred by electrophoresis to a nitrocellulose filter. This was analyzed for the presence of phosphorylated GST-Rb by a PhosphorImager (upper panels). The immunoprecipitated samples were checked for the presence of equal amounts of CDK2 and CDK4 proteins by Western blot analysis of the nitrocellulose filter (lower panels). INF., infected; I.P., immunoprecipitation.
FIG. 12
FIG. 12
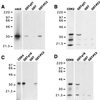
In vitro interactions of PC3 with CDKs. Shown is binding of GST, GST-PC3, and GST-p21 or GST-p16 to cdc2 (A), CDK2 (B), CDK4 (C), or CDK6 (D). Equal amounts of [35S]methionine-labeled CDKs (shown in the left lanes of each panel) were incubated with GST-PC3, GST-p21, or GST-p16, as indicated. Bound proteins were eluted and analyzed by SDS-PAGE (6% polyacrylamide for cdc2, 9% polyacrylamide for CDK2 and CDK6, and 12% polyacrylamide for CDK4) and autoradiography. Numbers at left of each panel are molecular masses in kilodaltons.
FIG. 13
FIG. 13
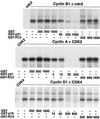
Effect of PC3 on the in vitro protein kinase activities of cyclin B1-cdc2, cyclin A-CDK2, and cyclin D1-CDK4. Lysates of Sf9 cells containing the indicated combination of cyclin-CDK and in the presence of increasing amounts (in nanograms) of GST-p21, GST-p16, GST-PC3, or GST were assayed in 20-μl reaction mixtures for GST-Rb phosphorylation by measuring incorporation of 32P. Samples were analyzed by SDS-PAGE. Shown is the autoradiograph from the area of the gel containing the GST-Rb protein. cdc2, CDK2, and CDK4 denote lysates from Sf9 cells infected with the CDK baculovirus alone as a control.
FIG. 14
FIG. 14
A working model of PC3 activity. PC3, by modulating cyclin D1 levels, leads to dephosphorylation of pRb and consequent growth arrest. PC3 is normally not expressed in proliferating cells but is induced in response to diverse growth arrest stimuli (e.g., terminal differentiation and DNA damage). The dashed lines indicate pathways not experimentally implicated in this report. phosph., phosphorylation; cyc, cyclin.

Similar articles

Cited by

References

    1. Abken H, Reifenrath B. A procedure to standardize CAT reporter gene assay. Nucleic Acids Res. 1992;20:3527. - PMC - PubMed
    1. Abramovich C, Yakobson B, Chebath J, Revel M. A protein-arginine methyltransferase binds to the intracytoplasmic domain of the IFNAR1 chain in the type I interferon receptor. EMBO J. 1997;16:260–266. - PMC - PubMed
    1. Agarwal M L, Agarwal A, Taylor W R, Stark G R. p53 controls both the G2/M and the G1 cell cycle checkpoints and mediates reversible growth arrest in human fibroblasts. Proc Natl Acad Sci USA. 1995;92:8493–8497. - PMC - PubMed
    1. Agarwal M L, Taylor W R, Chernow M V, Chernova O B, Stark G R. The p53 network. J Biol Chem. 1998;273:1–4. - PubMed
    1. Alevizopoulos K, Vlach J, Hennecke S, Amati B. Cyclin E and c-Myc promote cell proliferation in the presence of p16INK4a and of hypophosphorylated retinoblastoma family proteins. EMBO J. 1997;16:5322–5333. - PMC - PubMed

Publication types