Comparative Study
. 2000 Feb;214(2):453-66.
doi: 10.1148/radiology.214.2.r00fe17453.

Three-dimensional systolic strain patterns in the normal human left ventricle: characterization with tagged MR imaging

Affiliations
Comparative Study

Three-dimensional systolic strain patterns in the normal human left ventricle: characterization with tagged MR imaging

C C Moore et al. Radiology. 2000 Feb.

Abstract

Purpose: To present a database of systolic three-dimensional (3D) strain evolution throughout the normal left ventricle (LV) in humans.

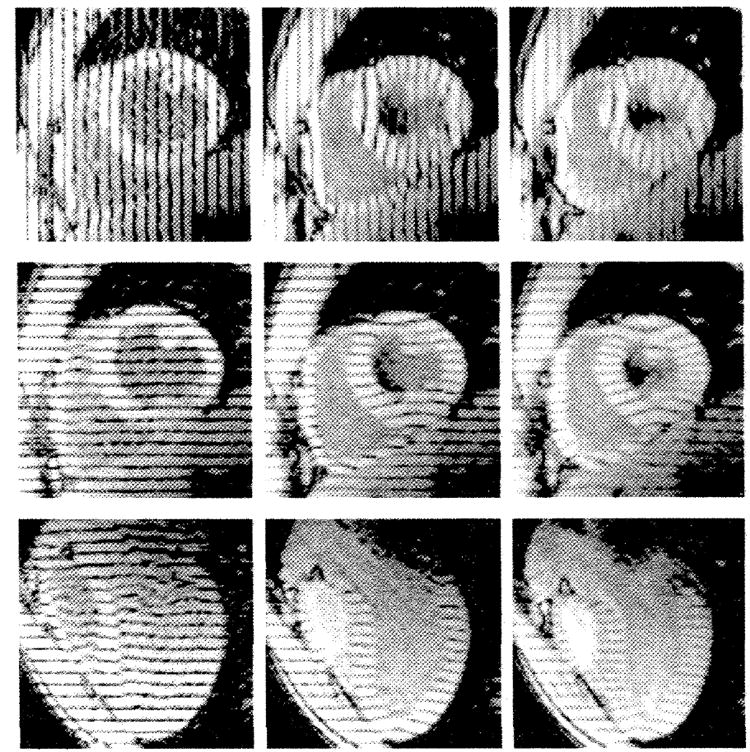
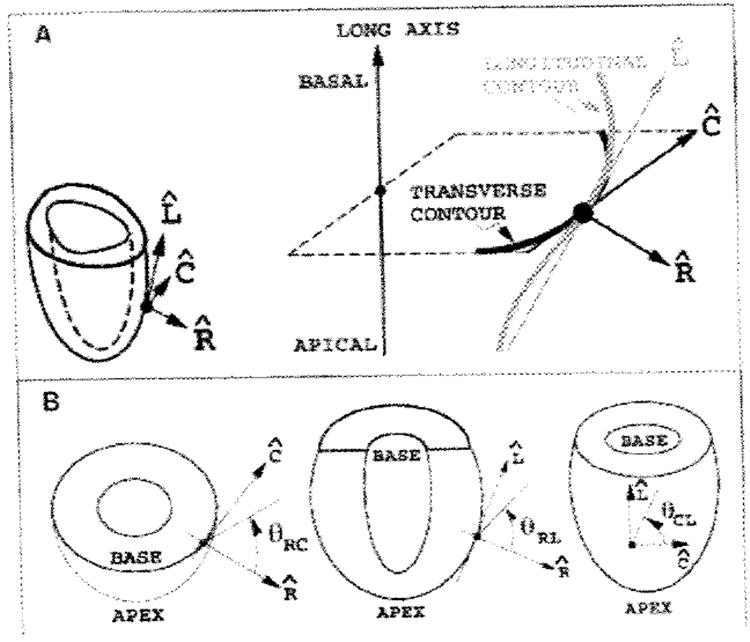
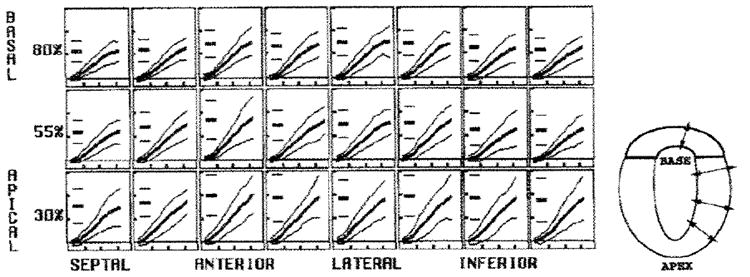
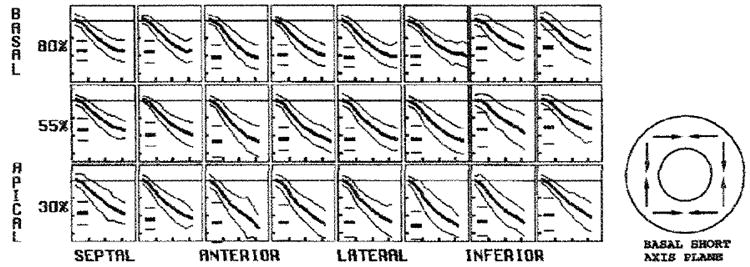
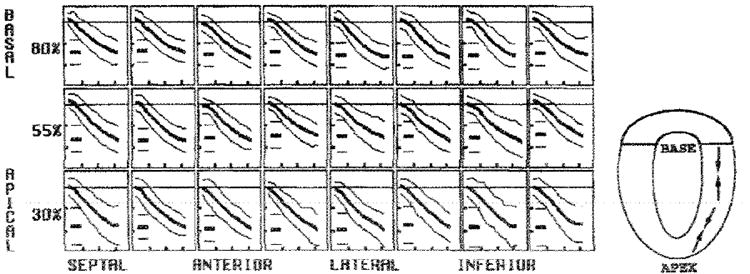
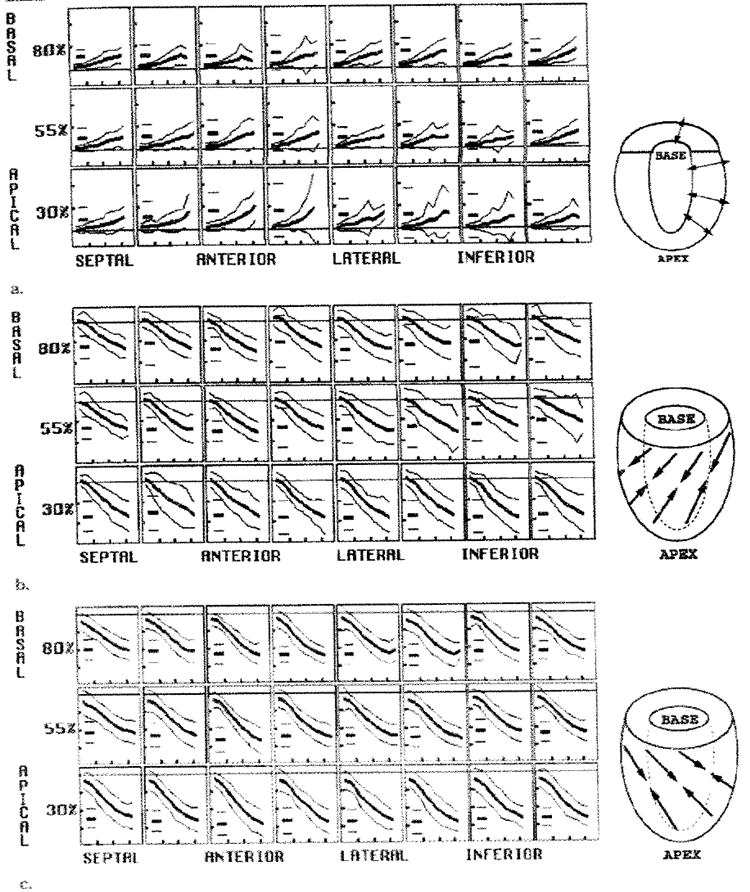
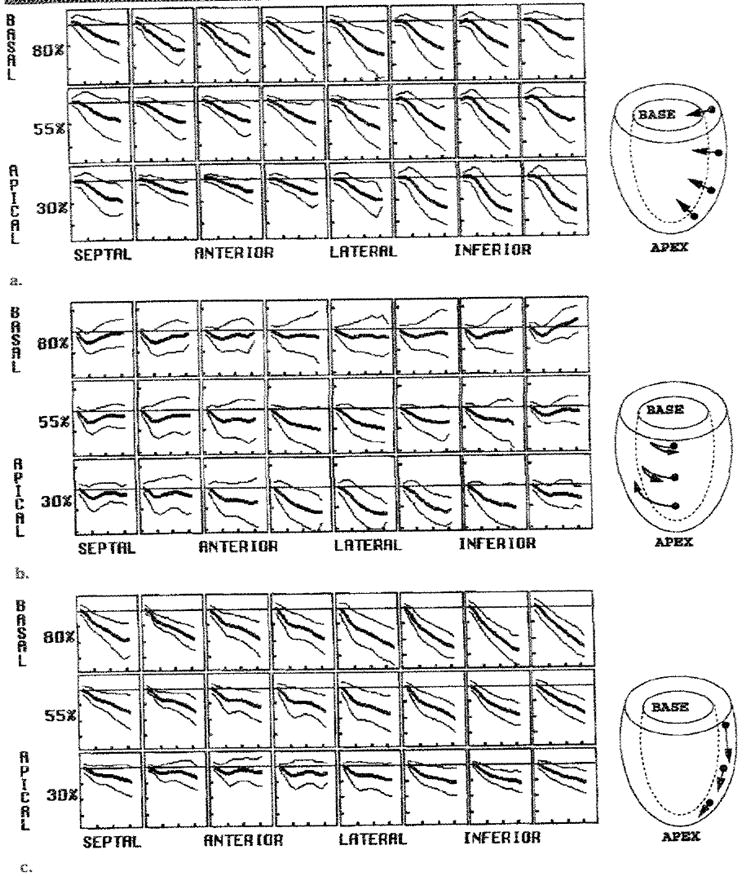
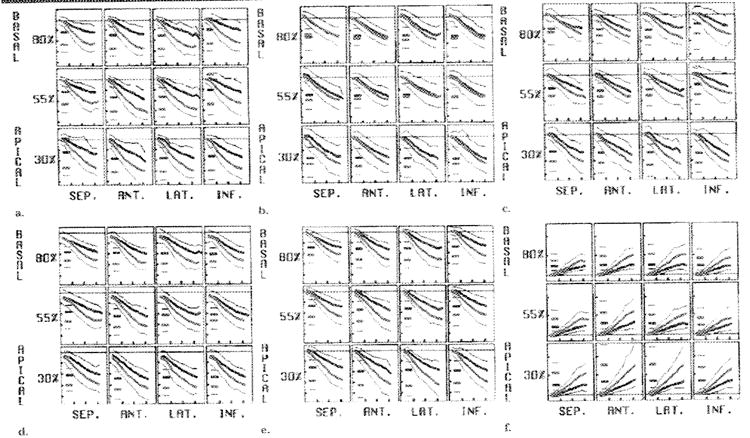
Materials and methods: In 31 healthy volunteers, magnetic resonance (MR) tissue tagging and breath-hold MR imaging were used to generate and then detect the motion of transient fiducial markers (ie, tags) in the heart every 32 msec. Strain and motion were calculated from a 3D displacement field that was fit to the tag data. Special indexes of contraction and thickening that were based on multiple strain components also were evaluated.

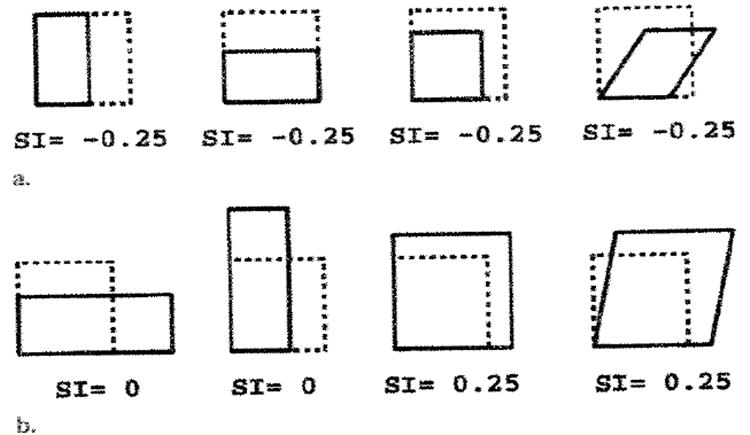
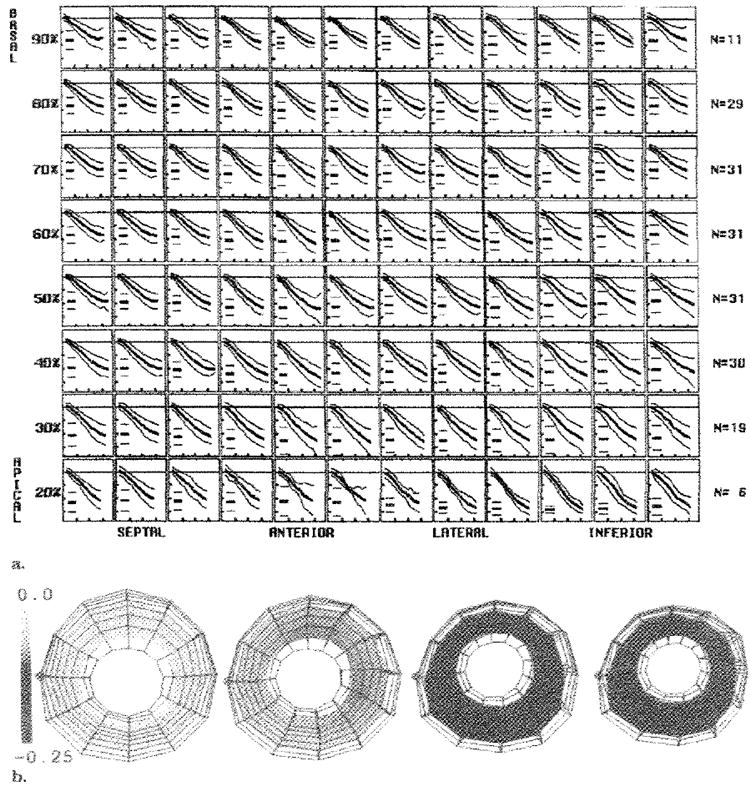
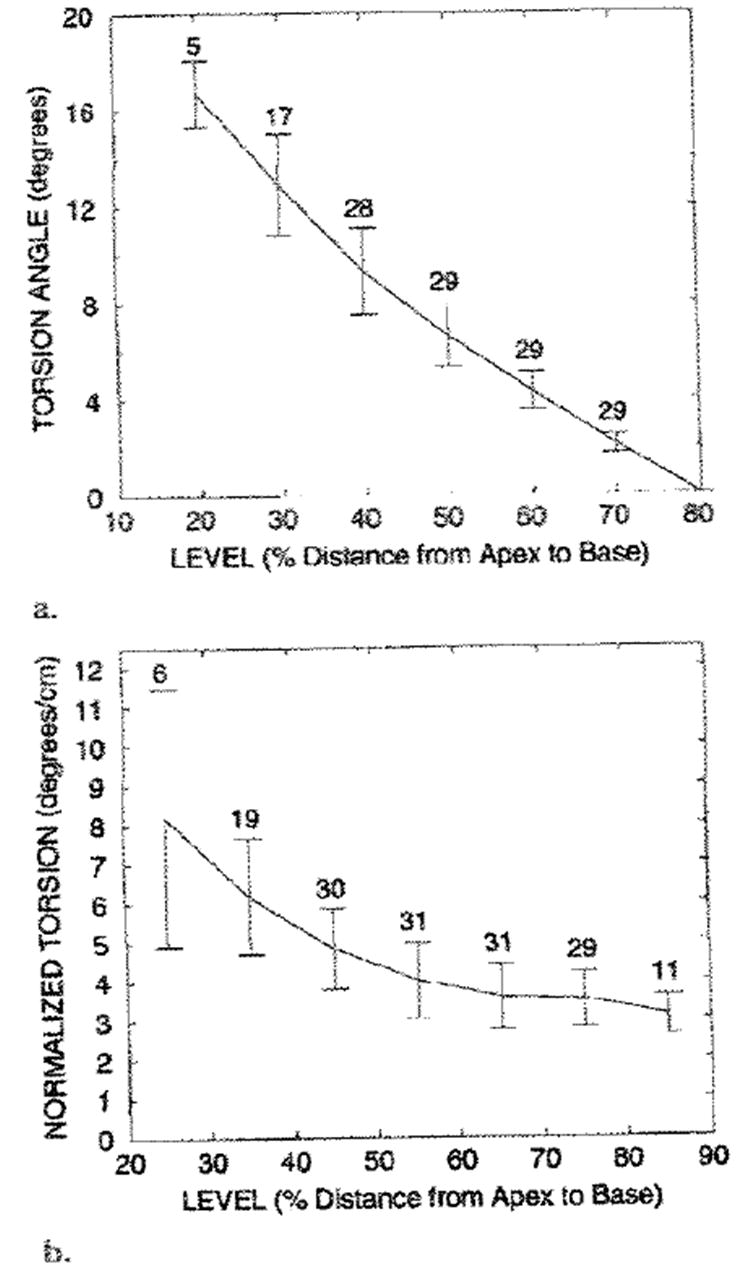
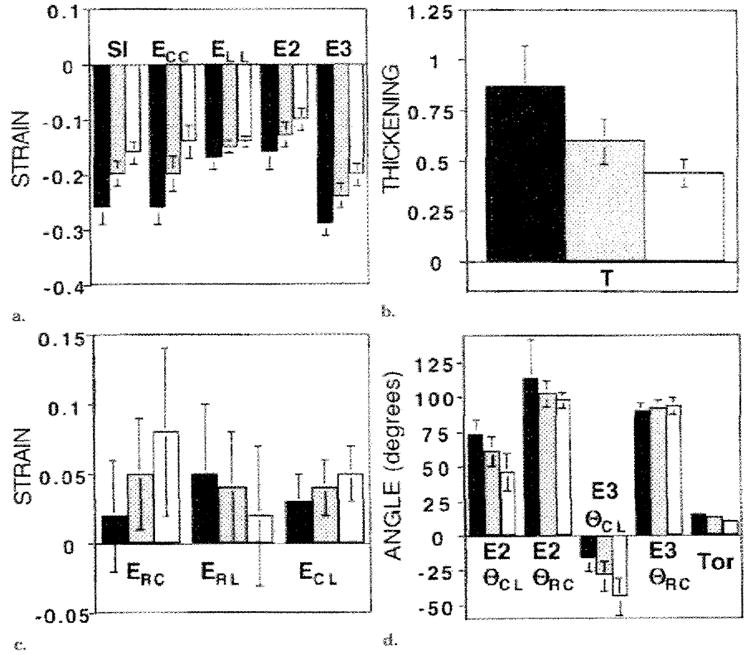
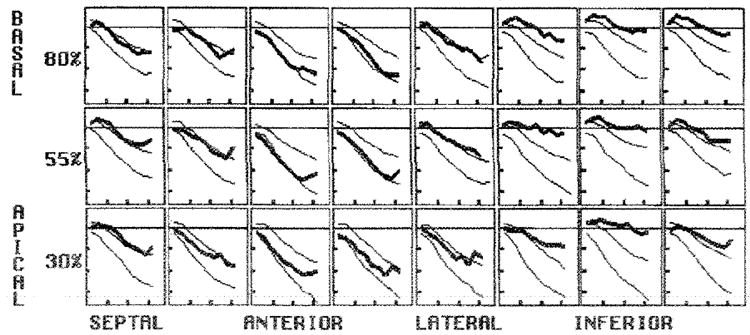
Results: The temporal evolution of local strains was linear during the first half of systole. The peak shortening and thickening strain components were typically greatest in the anterolateral wall, increased toward the apex, and increased toward the endocardium. Shears and displacements were more spatially variable. The two specialized indexes of contraction and thickening had higher measurement precision and tighter normal ranges than did the traditional strain components.

Conclusion: In this study, the authors noninvasively characterized the normal systolic ranges of 3D displacement and strain evolution throughout the human LV. Comparison against this multidimensional database may permit sensitive detection of systolic LV dysfunction.


Figures

Figure 1
Figure 1
Early (28 msec) (left), middle (188 msec) (middle), and late (351 msec) (right) systolic tagged MR images in a normal human heart. The top and middle rows show a basal short-axis section with different tag orientations, and the bottom row shows a long-axis section. Tag motion, as seen on these images, provides three orthogonal sets of one-dimensional displacement information throughout the heart wall.
Figure 2
Figure 2. Local coordinate systems and angles
In diagram A, a separate cartesian coordinate system, in which the axes are radial (R^), circumferential (C^), and longitudinal (L^), is defined for each material point. The material point is projected along the prolate radial direction to the epicardium, where the coordinate directions are determined. The local coordinate system is detailed to the right. R^ is the epicardial outward normal vector, which is normal to the heart contours in transverse and longitudinal sections. C^ is the cross product of the long axis with R^ which ensures that C^ lies In the transverse plane. L^ is the cross product of R^×C^, which lies in the longitudinal plane. Diagram B shows the angles used to describe principal strain directions. At left, the angle in the R^C^ plane (θRC) and C^L^is measured from R^ to R^; similar definitions for R^L^ plane (θRL) and C^L^ plane (θCL) are shown in the middle and left drawings, respectively.
Figure 3
Figure 3. Examples of SI deformations
The area inside the dashed lines represents the undeformed state within the plane. (a) Various contractions, all of which have area decreases (44%) that correspond to SI values of −0.25. With uniform contraction (3rd from left), both of the deformed edges, which reflect geometric mean shortening, are 25% shorter. (b) Abnormal deformations. No mean shortening or area change is seen in the two left panels, and increases ate seen in the two right panels.
Figure 4
Figure 4. Average SI at midwall
(a) Each box represents a midwall material point, with longitudinal levels from 20% to 90% of the distance from the apex to the base, and circumferential sectors spaced from the left to the right, as labeled. The number of hearts averaged (N)at each level is shown on the right. Within each box, the evolution of the SI, with the mean (thick middle line) and both 2-SD (thin outer lines) lines, are shown. The short horizontal lines at the left in each box represent the mean and 2-SD values of the peak SI. The horizontal ticks are spaced every 100 msec, and the vertical ticks are spaced every 0.1. (b) Three-dimensional renderings of the LV viewed from the apex. The middle of the septum (green dot) is on the left. The wire frame of all material points is shown at 46 msec, 143 msec, 241 msec, and 338 msec, with the midwall surface colored according to the value of the average SI. Tight normal ranges with smooth evolution are seen throughout the left ventricle with the SI.
Figure 5
Figure 5. Average midwall thickening parameter
The circumferential sector changes are illustrated in each box, from the left to the right, and the longitudinal level varies from the top row (basal) to the bottom row (apical). In each box, the evolution curves are shown as the mean (thick middle line) ± 2 SDs (thin outer lines). The short horizontal lines at the left in each box represent the mean and 2-SD peak values. The vertical ticks are spaced every 0.4, and the horizontal ticks are spaced every 100 msec. A schematic drawing of wall thickening is on the right. Tight normal ranges with smooth evolution and spatial heterogeneity were seen throughout the LV with the wall thickening parameter.
Figure 6
Figure 6. Average ECC at midwall
In each box, the evolution curves are shown as the mean (thick middle line) ± 2 SDs (outer thin lines). The short horizontal lines at the left in each box represent the mean and 2-SD peak values. The vertical ticks are spaced every 0.1. and the horizontal ticks arc spaced every 100 msec. A schematic drawing of ECC is on the right. The circumferential contraction amplitude was greater to the anterior wall than in the inferoseptal region and increased toward the apex.
Figure 7
Figure 7. Average ELL at midwall
In each box, the evolution curves are shown as the mean (thick middle line) ± 2 SDs (thin outer lines). The short horizontal lines at the left in each box represent the mean and 2-SD peak values. The vertical ticks are spaced every 0.1. and the horizontal ticks are spaced every 100 msec. A schematic drawing of ELL is on the right. The ELL was homogeneous about the circumference and increased from base to the apex.
Figure 8
Figure 8. Average midwall principal strains
The (a) E1, (b) E2, and (c) E3 are illustrated. In each box, the evolution curves are shown as the mean (thick middle line) ± 2 SDs (thin outer lines). The short horizontal lines at the left in each box represent the mean and 2-SD peak values. The horizontal ticks are spaced every 100 msec, and the vertical ticks are spaced every 0.8 in a and every 0.1 in b and c. The drawings to the right of each array plot illustrate typical directions of strain.
Figure 9
Figure 9. Average midwall displacements
Average and 2-SD curves for (a) radial, (b) circumferential, and (c) longitudinal displacements (in mm) are shown. (a) Radial inward (negative) motion was heterogeneous and greatest in the anterior wall. (b) Average circumferential displacement (viewed front the base) was initially clockwise at the base before reversing and returning to nearly the starting position by end systole. At the apex, it was steadily clockwise, producing net torsion about the long axis by end systole. (c) The longitudinal motion in the base-to-apex direction (negative) was greatest at the base and least at the apex. In each panel, the horizontal ticks are spaced every 100 msec, and the vertical ticks are spaced every 4 mm. Typical motions are illustrated in the drawings on the right.
Figure 10
Figure 10. Graphs illustrate the average peak torsion at midwall
(a) The torsion angle was calculated relative to the most basal (80%) level and increased linearly toward the apex. The positive torsion angles represent the clockwise rotation of a level relative to the basal (80%) level, as viewed from the base. (b) The torsion between adjacent levels, as normalized by the long-axis separation at the deformed state, is shown. Normalized torsion increased nonlinearly toward the apex. In a and b, the mean value curve, SDs (vertical bars), and number of measurements at each level are shown.
Figure 11
Figure 11. Transmural variation of average axial strains and indexes
(a) ECC, (b) ELL, (c) E2, (d) E3, (e) SI, and (f) wall thickening are illustrated. As expected from geometric constraints, the mean axial strain magnitudes at the endocardium (thick red line) exceed those at the epicardium (thick black line); a single 2-SD curve (thin red and black lines) is shown for each. The short horizontal lines at the left in each box represent the mean and 2-SD values for the peak strain. The horizontal ticks are spaced every 100 msec, and the vertical ticks are spaced every 0,1 in ae and every 0.8 in f. ANT. = anterior, INF. = inferior, LAT. = lateral, SEP. = septal.
Figure 12
Figure 12. Graphs illustrate transmural variation of spatially averaged strains
The black bars represent the values at the endocardium; gray bars, values at the midwall; and white bars, values at the epicardium. The (a) axial strains and SI, (b) wall thickening parameter, (c) shears, and (d) principal angles and the torsion angle between the 80% and 30% levels are illustrated. Significant transmural gradients were seen for all components (P < .005 for each). In b, T = wall thickening, and in d, Tor = torsion.
Figure 13
Figure 13. Use of the database of normal strain patterns to evaluate a postinfraction LV
The SI evolution of a human LV 3 months after a nontransmural inferior infraction (thick line) is plotted with the two normal 2 SDs (thick lines) for each position. Relative to the normal range, there was a decrease in the strain rate (slope) and level of peak contraction in the inferior wall compared with that in the other regions. In addition, there was tranisent, early systolic wall stretching (intital positive values) in the basal inferior wall followed by contraction. The vertical ticks are spaced every 0.1, and the horizontal ticks are spaced everry 100 msec.

References

    1. Potel MJ, Rubin JM, MacKay SA, Aisen AM, AISadar J, Sayre RE. Methods for evaluating cardiac will motion in three dimensions using bifurcation points of the coronary artery tree. Invest Radiol. 1983;18:47–57. - PubMed
    1. Young AA, Hunter PJ, Smaill BH. Estimation of epicardial strain using the motions of coronary bifurcations in biplane cineangiography. IEEE Trans Biomed Eng. 1992;39:526–531. - PubMed
    1. Ingels NB, Daughters GT, Stinson EB, Alderman EL. Measurement of midwall myocardial dynamics in intact man by radiography of surgically implanted markers. Circulation. 1975;52:859–867. - PubMed
    1. Hansen D, Daughters G, II, Alderman E, Ingels N, Jr, Miller DC. Torsional deformation of the left ventricular midwall in human hearts with intramyocardial markers: regional heterogeneity and sensitivity to the inotropic effects of abrupt rate changes. Circ Res. 1988;62:941–952. - PubMed
    1. Ingels NB, Jr, Hansen DE, Daughters GT, II, Stinson EB, Alderman EL, Miller DC. Relation between longitudinal, circumferential, and oblique shortening and torsional deformation in the left ventricle of the transplanted human heart. Circ Res. 1989;64:915–927. - PubMed

Publication types

MeSH terms