. 2000 Feb 15;523 Pt 1(Pt 1):193-209.
doi: 10.1111/j.1469-7793.2000.t01-1-00193.x.

Voltage-gated currents distinguish parvocellular from magnocellular neurones in the rat hypothalamic paraventricular nucleus

Affiliations

Voltage-gated currents distinguish parvocellular from magnocellular neurones in the rat hypothalamic paraventricular nucleus

J A Luther et al. J Physiol. .

Abstract

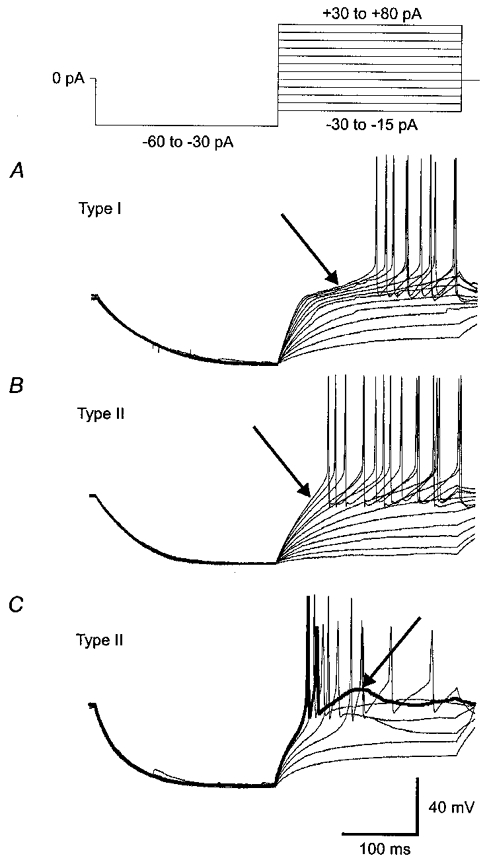
1. Magnocellular and parvocellular neurones of the hypothalamic paraventricular nucleus (PVN) differentially regulate pituitary hormone secretion and autonomic output. Previous experiments have suggested that magnocellular, or type I neurones, and parvocellular, or type II neurones, of the PVN express different electrophysiological properties. Whole-cell patch-clamp recordings were performed in hypothalamic slices to identify the voltage-gated currents responsible for the electrophysiological differences between type I and type II PVN neurones. 2. Type I neurones, which display transient outward rectification and lack a low-threshold spike (LTS), generated a large A-type K+ current (IA) (mean +/- s.e. m.: 1127.5 +/- 126.4 pA; range: 250-3600 pA; voltage steps to -25 mV) but expressed little or no T-type Ca2+ current (IT). Type II neurones, which lack transient outward rectification but often display an LTS, expressed a smaller IA (360.1 +/- 56.3 pA; range: 40-1100 pA; voltage steps to -25 mV), and 75 % of the type II neurones generated an IT (-402.5 +/- 166.9 pA; range: -90 to -2200 pA; at peak). 3. The voltage dependence of IA was shifted to more negative values in type I neurones compared to type II neurones. Thus, the activation threshold (-53.5 +/- 0.9 and -46.1 +/- 2.6 mV), the half-activation potential (-25 +/- 1.9 and -17.9 +/- 2.0 mV), the half-inactivation potential (-80.4 +/- 9.3 and -67.2 +/- 3.0 mV), and the potential at which the current became fully inactivated (-57.4 +/- 2.1 and -49.8 +/- 1.5 mV) were more negative in type I neurones than in type II neurones, respectively. 4. IT in type II neurones activated at a threshold of -59.2 +/- 1.2 mV, peaked at -32. 6 +/- 1.7 mV, was half-inactivated at -66.9 +/- 2.2 mV, and was fully inactivated at -52.2 +/- 2.2 mV. 5. Both cell types expressed a delayed rectifier current with similar voltage dependence, although it was smaller in type I neurones (389.7 +/- 39.3 pA) than in type II neurones (586.4 +/- 76.0 pA). 6. In type I neurones IA was reduced by 41.1 +/- 7.0 % and the action potential delay caused by the transient outward rectification was reduced by 46.2 +/- 10.3 % in 5 mM 4-aminopyridine. In type II neurones IT was reduced by 66.8 +/- 10.9 % and the LTS was reduced by 76.7 +/- 7.8 % in 100 microM nickel chloride, but neither IT nor LTS was sensitive to 50 microM cadmium chloride. 7. Thus, differences in the electrophysiological properties between type I, putative magnocellular neurones and type II, putative parvocellular neurones of the PVN can be attributed to the differential expression of voltage-gated K+ and Ca2+ currents. This diversity of ion channel expression is likely to have profound effects on the response properties of these neurosecretory and non-neurosecretory neurones.


Figures

Figure 1
Figure 1. Type I, putative magnocellular neurones and type II, putative parvocellular neurones were distinguished on the basis of the expression of a transient outward rectification and a low-threshold spike
A, type I neurones expressed a pronounced transient outward rectification. When hyperpolarised, a type I neurone responded to depolarising current injections (top) with transient outward rectification (arrow), which was characterised by a dampening of the membrane charging curve and a delay to the onset of the first action potential. B, transient outward rectification was absent in type II neurones. A similar stimulation protocol in a type II neurone failed to reveal transient outward rectification (arrow). C, many type II neurones generated a low-threshold spike. A type II neurone responded to a series of depolarising current pulses from a hyperpolarised membrane potential with the generation of a low-threshold spike (arrow). A single trace is shown as a thick line to illustrate the low-threshold spike. The number and amplitude of the depolarising pulses, and the amplitude of the hyperpolarising current pulses differed between cells, as depicted by the range of current pulses illustrated (top).
Figure 2
Figure 2. The IA was smaller and had a more depolarised voltage dependence of activation in type II neurones than in type I neurones
A, outward currents recorded in type I and type II PVN neurones had both a transient (IA) and sustained component (IK) in response to depolarisation from a 200 ms conditioning step to −100 mV. Depolarising test steps from a holding potential of −50 mV elicited only IK. IA was isolated (difference current) by digitally subtracting currents generated with a conditioning step to −50 mV from currents generated with a conditioning step to −100 mV. Currents shown were generated in a type II neurone with test steps to −10 mV. B, families of A-currents generated in a type I neurone and in a type II neurone with the protocol described in A, using test steps to between −70 and +20 mV in 5 mV increments. C, frequency histogram of peak IA amplitudes generated in type I and type II neurones with steps from −100 mV to −25 mV. The mean amplitude of IA at −25 mV was threefold larger in type I neurones (1098.5 ± 126.1 pA; n = 36) than in type II neurones (360.1 ± 56.3 pA; n = 24) (P < 0.01). D, a plot of the normalised chord conductance (gchord = I/(VstepVK,rev)) of IAversus test step potential, generated using the protocol described in A. The voltage dependence of activation was shifted in a positive direction in type II neurones (n = 15) by approximately 8 mV compared to type I neurones (n = 20). Curves: Boltzmann functions with half-activation voltages of −31.6 and −18.0 mV, and slope factors of 11.3 and 10.4 mV for type I and type II neurones, respectively.
Figure 3
Figure 3. Slower rate of activation of IA in type II neurones than in type I neurones
A, the 10–90 % rise time of IA is shown for a type I neurone (left) and a type II neurone (right). IA was generated with voltage steps to −25 mV from −100 mV. B, plot of mean ( ± s.e.m.) 10–90 % rise time against test step potential. The IA activation rate was voltage dependent in both cell types, decreasing with greater depolarisation. The 10–90 % rise time of IA was slower in type II neurones (n = 14) than in type I neurones (n = 18) with test steps to −40 mV, −25 mV, and +20 mV (P < 0.01).
Figure 4
Figure 4. The voltage dependence of inactivation of IA was more depolarised in type II neurones than in type I neurones
A, families of A-currents recorded in a type I neurone and in a type II neurone in response to voltage steps to −25 mV from 200 ms conditioning steps to between −120 and −35 mV in 5 mV increments. B, plot of the mean normalised peak IAversus conditioning step potential. The half-inactivation potentials were −67.2 ± 3.0 and −80.4 ± 9.3 mV (P < 0.01) and steady-state inactivation of IA occurred at −49.8 ± 1.5 and −57.4 ± 2.1 mV (P < 0.05) in type II neurones (n = 12) and in type I neurones (n = 17), respectively. Curves: Boltzmann functions with half-inactivation voltages of −80.1 and −65.4 mV, and slope factors of −8.8 and −9.5 mV for type I and type II neurones, respectively.
Figure 5
Figure 5. The rates of inactivation and recovery from inactivation of IA did not differ between type I and type II neurones
A, the rate of inactivation was examined by fitting the IA decay phase with a single exponential function to determine the inactivation time constant. The inactivation time constants of IA elicited by a test step to −25 mV from −100 mV were similar in a type I neurone and a type II neurone. B, the rate of inactivation of IA was voltage dependent and became faster with increasing depolarisation. It did not differ significantly between type I neurones (n = 13) and type II neurones (n = 12) at test step potentials of −40 mV, −25 mV and −10 mV. C, superimposed currents elicited by a test step to −25 mV from conditioning steps to −100 mV of increasing duration in a type I neurone and a type II neurone. Currents elicited following 24, 120 and 200 ms conditioning steps are shown as thick lines for comparison. D, plots of the mean normalised peak current versus the conditioning step duration were fitted with single exponentials that had a similar τ in both cell types (34.9 ± 5.1 and 32.1 ± 4.6 ms in type I (n = 15) and type II neurones (n = 10), respectively).
Figure 6
Figure 6. Sensitivity of IA to block by 4-AP
A,IA in a representative type I neurone was inhibited by 55 % in 5 mm 4-AP. B, the sensitivity of IA to 4-AP varied widely in type II neurones. IA was inhibited by 81 % in one type II neurone with 5 mm 4-AP (top), but the same concentration blocked only 10 % of the current in another type II neurone (bottom). IA was generated in all three cells with steps from −100 mV to −25 mV. C, type I neurones and type II neurones showed different sensitivities to 5 mm 4-AP. IA was reduced by 41.1 ± 7.0 % in type I neurones. Type II neurones were divided into two groups, 4-AP-sensitive cells (> 40 % block of IA at 5 mm) and 4-AP-insensitive cells (< 20 % block of IA). IA was reduced by 69.2 ± 7.3 % in 4-AP-sensitive type II neurones, and by 10.2 ± 3.5 % in 4-AP-insensitive type II neurones (*P < 0.05, one-way ANOVA followed by Tukey's pair-wise comparison).
Figure 7
Figure 7. IT was expressed predominantly in type II neurones
A, a family of T-currents were elicited in a type II neurone with test steps to between −70 and −20 mV in 2.5 mV increments from a 500 ms conditioning step to −100 mV. B, frequency histogram of peak IT amplitude in type I and type II neurones. The IT amplitude varied widely among type II neurones (range: 0 to −2100 pA, measured with steps to −40 mV). Most type I neurones (8/10) did not exhibit a detectable IT under these recording conditions. C, current-voltage plot of mean peak IT amplitude versus test step potential in type II neurones (n = 10). The IT activated at a threshold of −59.2 ± 1.2 mV and peaked at −32.6 ± 1.7 mV. D, the activation rate, measured as the 10–90 % rise time (inset), of the IT in type II neurones was 10.1 ± 3.4 ms at −40 mV, and was voltage dependent, becoming faster at more depolarised test step potentials (n = 9).
Figure 8
Figure 8. Inactivation properties of IT in type II neurones
A, the voltage dependence of inactivation of IT was examined by stepping to −40 mV from conditioning steps to between −100 and −20 mV for 500 ms (inset). A plot of the mean normalised peak IT amplitude versus conditioning step potential for 13 type II neurones revealed a half-inactivation voltage of −66.9 ± 2.2 mV and steady-state inactivation at −52.2 ± 2.2 mV. Continuous line: Boltzmann function with half-activation at −68.7 mV and a slope factor of 3.9 mV. B, the time constant of inactivation of IT (inset) was 15.0 ± 1.3 ms at −40 mV and was voltage dependent, becoming shorter at more depolarised potentials (n = 9). C, recovery from inactivation was studied by stepping from a holding potential of −50 mV, which completely inactivated IT, to a −100 mV conditioning step of variable duration, followed by a test step to −40 mV. Currents elicited following 70, 290 and 490 ms are shown in bold for comparison. D, plot of the mean normalised peak current amplitude versus conditioning step duration (n = 6). IT recovered 100 % of its peak amplitude with conditioning steps lasting 523.3 ± 14.3 ms.
Figure 9
Figure 9. IT was blocked by nickel
Aa, IT in a type II neurone was reversibly reduced in 100 μM nickel chloride (steps to −40 mV from −100 mV). Ab, plot of the mean normalised current amplitude versus test step potential in control ACSF and in 100 μM nickel chloride. IT was reduced by 66.8 ± 10.9 % in 100 μM nickel chloride with steps to −35 mV (n = 7). Ba, IT in another type II neurone was not reduced by 50 μM cadmium chloride (steps to −40 mV from −100 mV). Bb, plot of the mean normalised current amplitude versus test step potential in control ACSF and in 50 μM cadmium chloride. The IT was not reduced, but was slightly facilitated by 50 μM cadmium chloride, although this effect was not significant (n = 6). ○, control values; •, values in nickel chloride (Ab) and in cadmium chloride (Bb).
Figure 10
Figure 10. The delayed rectifier current (IK) was similar in type I and type II neurones
A, IK was similar in a type I neurone and a type II neurone with respect to the slow rate of activation and lack of inactivation. IK was elicited with steps from −50 mV to −10 mV in both cells. B, frequency histogram of IK amplitudes. The distributions of IK amplitudes were similar in type I and type II neurones, although the overall mean IK amplitude was larger in type II neurones (586.4 ± 76.0 pA) than in type I neurones (389.7 ± 39.3 pA) (P < 0.05). The IK amplitude was measured at the end of 150 ms voltage steps from −50 mV to −10 mV. C, plot of normalised chord conductance of IK against test step potential. The voltage dependence of activation of IK was similar in type I and type II neurones. The mean activation threshold was −27.7 ± 1.7 mV in type I neurones (n = 12) and −28.8 ± 1.1 mV in type II neurones (n = 14), and IK peaked above +20 mV in both cell types. Curves: Boltzmann functions with half-activations of −6.3 and −7.1 mV and slope factors of 9.7 and 7.8 mV for type I and type II neurones, respectively.
Figure 11
Figure 11. Correlation of IA with transient outward rectification in type I neurones and IT with the low-threshold spike in type II neurones
A, the transient outward rectification was abolished with application of 5 mm 4-AP in a type I PVN neurone (top). In a different type I neurone, 5 mm 4-AP reduced the IA generated with steps from −100 mV to −40 mV by 46.6 % (bottom). B, IA amplitude was positively correlated with spike delay in type I neurones. A plot of the IA amplitude at −25 mV against the delay to the first spike observed when type I neurones were depolarized from −90 mV. C, both the low-threshold spike (top) and IT (bottom), in the same type II PVN neurone, were reduced in 100 μM nickel chloride by 52.0 and 78.2 %, respectively (voltage steps from −100 mV to −50 mV). Sodium action potentials were blocked with TTX (3 μM). D, IT amplitude was positively correlated with the amplitude of the low-threshold spike (LTS). A plot of the amplitude of IT against the amplitude of the LTS in type II neurones.

References

    1. Andreasen M, Hablitz JJ. Kinetic properties of a transient outward current in rat neocortical neurons. Journal of Neurophysiology. 1992;68:1133–1142. - PubMed
    1. Bicknell RJ, Leng G. Relative efficiency of neural firing patterns for vasopressin release in vitro. Neuroendocrinology. 1981;33:295–299. - PubMed
    1. Bielefeldt K, Rotter JL, Jackson MB. Three potassium channels in rat posterior pituitary nerve terminals. The Journal of Physiology. 1992;458:41–67. - PMC - PubMed
    1. Bourque CW. Transient calcium-dependent potassium current in magnocellular neurosecretory cells of the rat supraoptic nucleus. The Journal of Physiology. 1988;397:331–347. - PMC - PubMed
    1. Carbone E, Lux HD. A low voltage-activated, fully inactivating Ca channel in vertebrate sensory neurones. Nature. 1984;310:501–502. - PubMed

Publication types

LinkOut - more resources