. 2000 Feb 15;19(4):710-8.
doi: 10.1093/emboj/19.4.710.

Compartmentalization of transcription and translation in Bacillus subtilis

Affiliations

Compartmentalization of transcription and translation in Bacillus subtilis

P J Lewis et al. EMBO J. .

Abstract

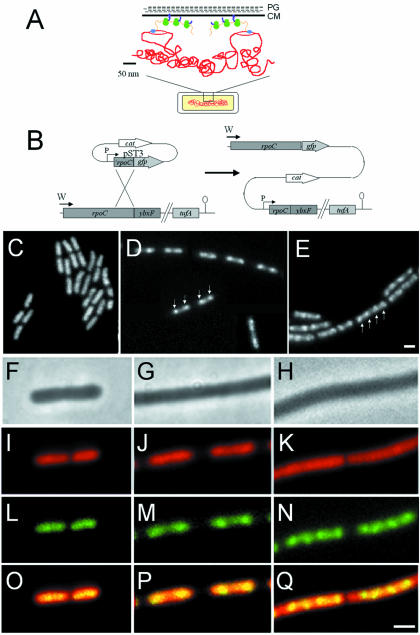
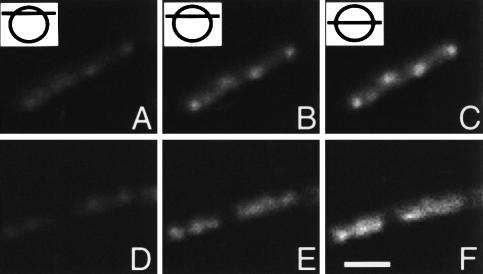
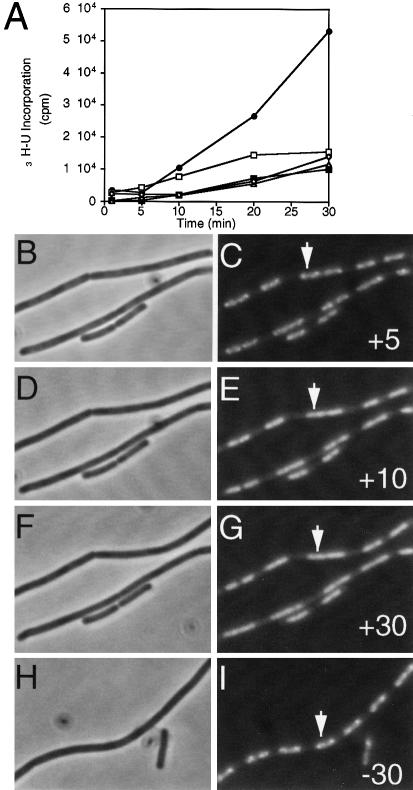
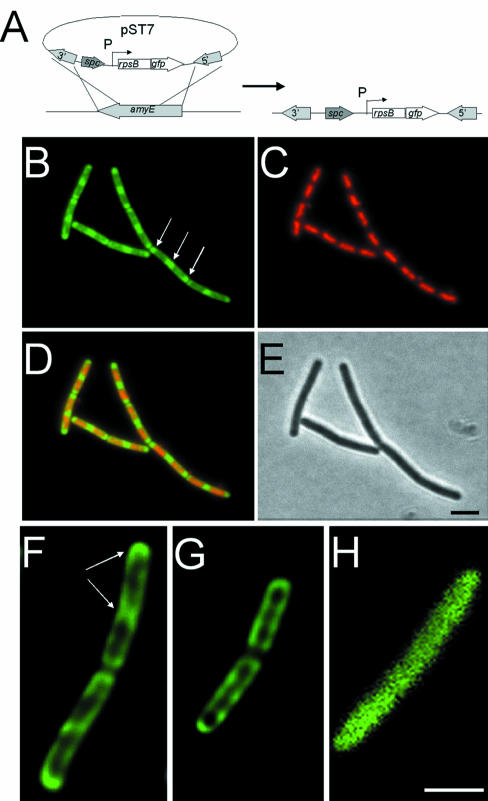
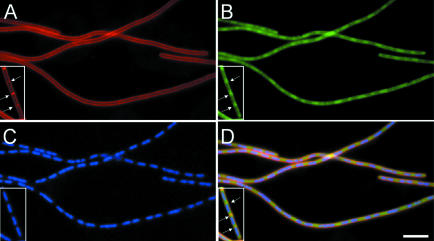
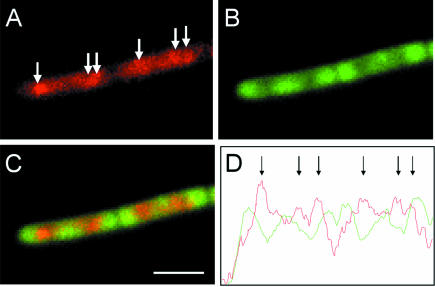
Using fusions of green fluorescent protein to subunits of RNA polymerase (RNAP) and ribosomes, we have investigated the subcellular localization of the transcriptional and translational machinery in the bacterium Bacillus subtilis. Unexpectedly, we found that RNAP resides principally within the nucleoid. Conversely, ribosomes localized almost exclusively outside the nucleoid, concentrating particularly towards sites of cell division. This zonal localization was not dependent on cell division and is probably due, at least in part, to exclusion from the nucleoid. Dual labelling of RNAP and ribosomes was used to confirm the spatial separation of the two processes. We conclude that, even in the absence of a nuclear membrane, transcription and translation occur predominantly in separate functional domains. At higher growth rates, concentrations of RNAP developed, probably representing the sites of rRNA synthesis. These may represent a further spatial specialization, possibly equivalent to the eukaryotic nucleolus.


Figures

None
Fig. 1. (A) Schematic representation of transcription and translational organization in bacteria (derived from Woldringh et al., 1995). PG, peptidoglycan; CM, cytoplasmic membrane. Gram-positive organisms do not contain an outer membrane. The boxed region of the cell (bottom) is shown in expanded form above. Transcription by RNAP (blue) from DNA (red) that has looped out from the dense central mass of the nucleoid is closely linked to translation by ribosomes (green) via mRNA (orange). In this figure, the translated proteins (purple) are being inserted simultaneously into the cell membrane, but cytoplasmic proteins have also been proposed to be transcribed and translated in a similar peripheral subcellular location (Woldringh et al., 1995). (B) Construction of the fusion strain 1048 by insertion of pST3 into the chromosome. Integration of pST3 fuses the full-length rpoC gene, under the control of its natural promoter (W), to gfp. The plasmid provides a xylose-inducible promoter (P) to drive transcription of downstream genes, beginning with a truncated copy of rpoC. tufA is the last gene of the operon and encodes elongation factor Tu. (C–E) Images of RNAP–GFP in cells grown at 37°C in S medium [(C) doubling time 70 min], CH medium [(D) doubling time 45 min] and 2TY medium [(E) doubling time 20 min]. (D) is a composite image due to the low density of cells in the sample. (F–Q) Further magnified images of typical cells. (F), (I), (L) and (O) Cells grown in S medium. (G), (J), (M) and (P) Cells grown in CH medium. (H), (K), (N) and (Q) Cells grown in 2TY medium. (F–H) Phase contrast images; (I–K) DAPI images false coloured red; (L–N) RNAP–GFP images false coloured green; (O–Q) overlays of DAPI and GFP images. Scale bar, 2 μm.
None
Fig. 2. High resolution localization of RNAP and Soj. Strains 1048 (rpoC–gfp) and 1960 (soj–gfp) were grown in CH medium at 37°C, and image slices obtained and processed to remove out of focus light as detailed in Materials and methods. Three slices taken from the image stacks are shown and cartoons with lines indicating the relative positions of the sections selected from the image stacks shown in the top left hand corners of (A–C). (AC) Strain 1048. (DF) Strain 1960. Scale bar, 2 μm.
None
Fig. 3. TFs disappear on induction of the stringent response. (A) The rate of incorporation of [3H]uridine into stable RNA in strain 1048 in various concentrations of R-HX: •, none (positive control); □, 250 μg/ml; ▪, 500 μg/ml; ▵ 1000 μg/ml; ⋄, 2000 μg/ml. (B–I) Cells with or without added R-HX. (BG) A time course of a field of cells acquired between 5 and 30 min after the addition of 500 μg/ml R-HX. (H and I) Images of control cells not treated with R-HX, 30 min after placing on an agarose slide. Times and the presence (+) or absence (–) of R-HX are indicated in the bottom right hand corners of the GFP images. (B), (D), (F) and (H) Phase contrast images. (C), (E), (G) and (I) GFP images. The arrow in (C), (E) and (G) indicates a cell displaying a typical bifocal RNAP distribution prior to induction of the stringent response; in (I), a control cell with a bifocal RNAP distribution is shown.
None
Fig. 4. Ribosome distribution in exponentially growing and stationary phase cells. (A) Construction of the fusion strain 1049 by insertion of pST7 into the chromosome. Integration of pST7 into the amyE gene allows induction of rps–gfp expression from the xylose-inducible promoter (P). (B–D) Distribution of ribosomes in strain 1049 grown in CH medium. (B) RpsB–GFP image false coloured green. Polar ribosomal concentrations are indicated with arrows. (C) DAPI image false coloured red. (D) Image overlays. (E) Phase contrast image. (F–H) Image slices taken from the middle of exponentially growing (F) and stationary phase (G) strain 1049, and exponentially growing strain 1758 (H). The image in (H) has been magnified 2.5 times as it was obtained without the optovar used to acquire the images in (F) and (G), due to the lower signal intensity in this sample. Scale bar, 2 μm.
None
Fig. 5. Ribosome distribution is due to nucleoid exclusion effects. Images of cells from strain 1054 grown in CH medium in the presence (inserts) or absence of IPTG are shown. (A) FM4-64 membrane stain showing cytoplasmic membranes. (B) RpsB–GFP distribution. (C) DAPI stain showing chromosomes. (D) Overlay of all three images. Cell division sites are marked by arrows in the insert. No septa were visible in the filaments after depletion of the division protein FtsZ. Scale bar, 5 μm.
None
Fig. 6. Dual labelling of RNAP and ribosomes indicates that they occupy separate subcellular domains. (A–C) Images of a pair of cells from strain 1056 grown in CH medium. (A) RpoC–GFPuv distribution, false coloured red. The arrows indicate the positions of TFs. (B) RpsB–GFP distribution. (C) Image overlays. (D) Fluorescence intensity profile along a line through the image overlay, with Rpo–GFPuv (red) and RpsB–GFP (green) signals. Peaks in the RpoC–GFPuv signal are indicated with arrows. Scale bar, 2.5 μm.

References

    1. Anagnostopoulos C. and Spizizen, J. (1961) Requirements for transformation in Bacillus subtilis.J. Bacteriol., 81, 741–746. - PMC - PubMed
    1. Asai T., Condon, C., Voulgaris, J., Zaporojets, D., Shen, B., Al-Omar, M., Squires, C. and Squires, C.L. (1999) Construction and initial characterisation of Escherichia coli strains with few or no intact chromosomal rRNA operons. J. Bacteriol., 181, 3803–3809. - PMC - PubMed
    1. Beall B. and Lutkenhaus, J. (1991) FtsZ in Bacillus subtilis is required for vegetative septation and for asymmetric septation during sporulation. Genes Dev., 5, 447–455. - PubMed
    1. Bremer H. and Dennis,P.D. (1996) Modulation of chemical composition and other paramerters of the cell by growth rate. In Neidhardt,F.C., Ingraham,J.L., Low,K.B., Megasanik,B., Schaecter,M. and Umbarger.H.E. (eds), Escherichia coli and Salmonella typhimurium: Cellular and Molecular Biology. 2nd edn. American Society for Microbiology Press, Washington, DC, pp. 1553–1569.
    1. Cashel M., Gentry,D.R., Hernandez,V.J. and Vinella,D. (1996) The stringent response. In Neidhardt,F.C., Ingraham,J.L., Low,K.B., Megasanik,B., Schaecter,M. and Umbarger.H.E. (eds), Escherichia coli and Salmonella typhimurium: Cellular and Molecular Biology. 2nd edn. American Society for Microbiology Press, Washington, DC, pp. 1458–1496.

Publication types

MeSH terms

LinkOut - more resources