. 2000 Feb;122(2):295-318.
doi: 10.1104/pp.122.2.295.

Patterns of protein synthesis and tolerance of anoxia in root tips of maize seedlings acclimated to a low-oxygen environment, and identification of proteins by mass spectrometry

Affiliations

Patterns of protein synthesis and tolerance of anoxia in root tips of maize seedlings acclimated to a low-oxygen environment, and identification of proteins by mass spectrometry

W W Chang et al. Plant Physiol. 2000 Feb.

Abstract

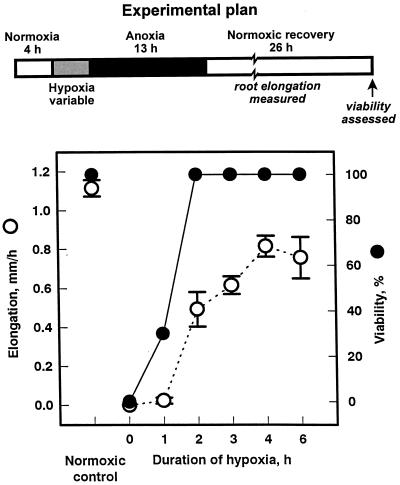
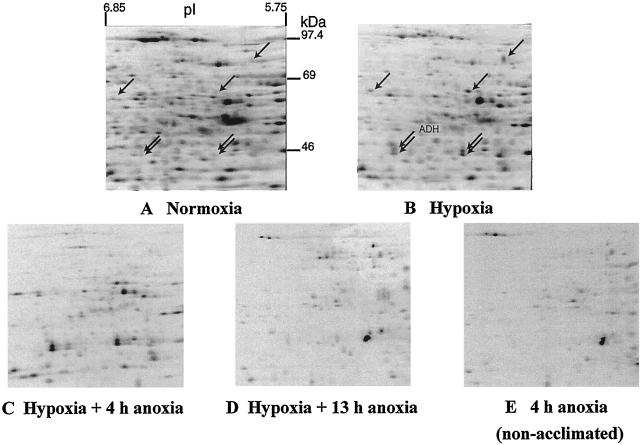
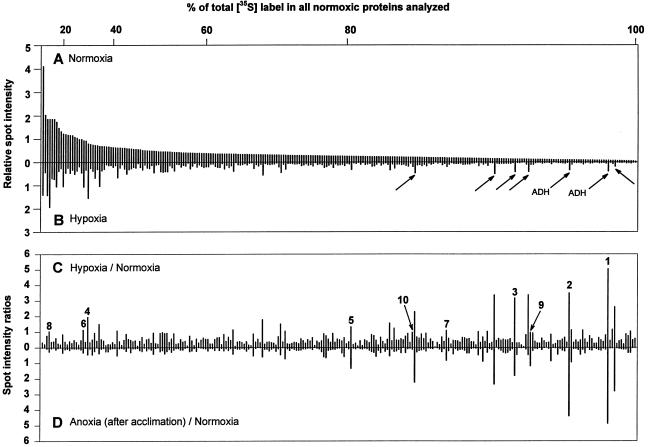
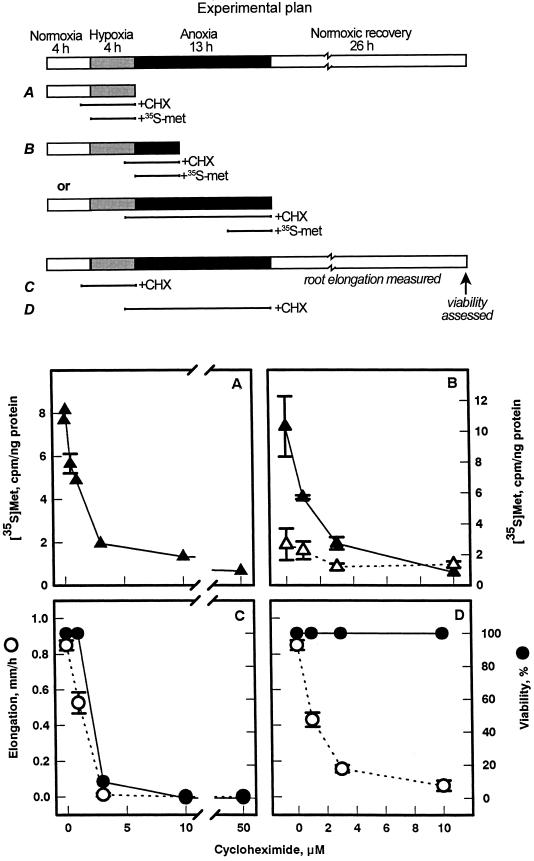
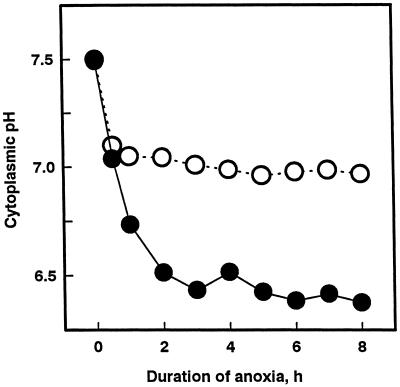
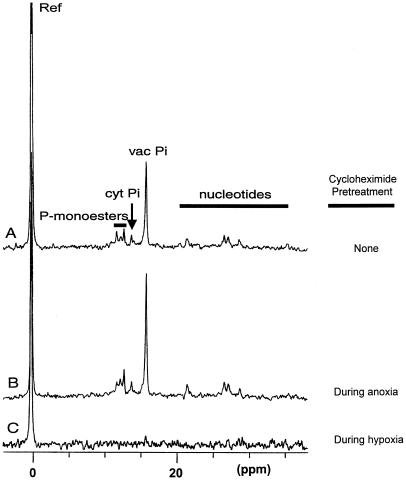
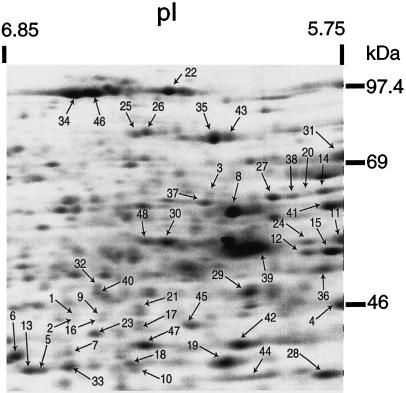
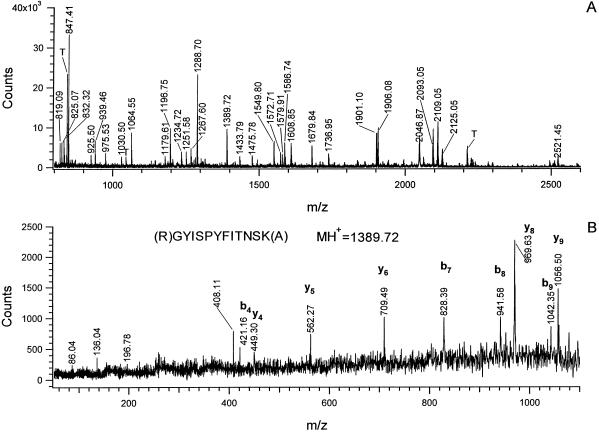
Tolerance of anoxia in maize root tips is greatly improved when seedlings are pretreated with 2 to 4 h of hypoxia. We describe the patterns of protein synthesis during hypoxic acclimation and anoxia. We quantified the incorporation of [(35)S]methionine into total protein and 262 individual proteins under different oxygen tensions. Proteins synthesized most rapidly under normoxic conditions continued to account for most of the proteins synthesized during hypoxic acclimation, while the production of a very few proteins was selectively enhanced. When acclimated root tips were placed under anoxia, protein synthesis was depressed and no "new" proteins were detected. We present evidence that protein synthesis during acclimation, but not during subsequent anoxia, is crucial for acclimation. The complex and quantitative changes in protein synthesis during acclimation necessitate identification of large numbers of individual proteins. We show that mass spectrometry can be effectively used to identify plant proteins arrayed by two-dimensional gel electrophoresis. Of the 48 protein spots analyzed, 46 were identified by matching to the protein database. We describe the expression of proteins involved in a wide range of cellular functions, including previously reported anaerobic proteins, and discuss their possible roles in adaptation of plants to low-oxygen stress.


Figures

Figure 1
Figure 1
Effect of duration of hypoxic pretreatment on maize root tip tolerance to 13 h of anoxia. Intact seedlings were pretreated under hypoxia for various lengths of time, followed by 13 h of anoxia and 26 h of normoxia (see schematic, “Experimental plan”). Tolerance was assessed using root growth and root tip viability assays. Growth data are mean values ± se (n = 10). Viability data are aggregates of three independent experiments, from observations of a total of 30 seedlings for each point. Normoxic control seedlings of the same developmental age were exposed to 100% (v/v) O2 only.
Figure 2
Figure 2
Effects of low-O2 treatments on patterns of protein synthesis in intact maize root tips. Data are fluorographs of root tip proteins, labeled in vivo with [35S]Met and separated by two-dimensional IEF-SDS-PAGE. Fifteen 6-d-old (post imbibition) seedlings were labeled with [35S]Met during the last 4 h of each treatment. A, Normoxia, 8 h under 100% (v/v) O2. B, Hypoxia, 4 h of O2, 4 h of 3% (v/v) O2. C, Hypoxia plus 4 h of anoxia, 4 h of O2, 4 h of 3% (v/v) O2, 4 h of N2. D, Hypoxia plus 13 h of anoxia, 4 h of O2, 4 h of 3% (v/v) O2, 13 h of N2. E, 4 h of anoxia, 8 h of O2, 4 h of N2 (non-acclimated). Root tip proteins (100 μg per sample) were fractionated by two-dimensional IEF-SDS-PAGE, and labeled proteins were visualized by fluorography using an exposure time of 95 h. Arrows in A and B point to proteins that were induced greater than 2-fold by hypoxic treatment. ADH was identified by western blot and confirmed by MS.
Figure 3
Figure 3
Relative incorporation of [35S]Met into individual proteins in maize root tips before, during, and after acclimation. A and B, Relative densitometric intensities of 262 spots from normoxic or hypoxic root tips; spots are ranked from the most to the least intense in the fluorograph of normoxic protein synthesis. The horizontal axis above A shows the percent of radiolabel incorporated into spots to the left of each tick mark. Arrows in B indicate proteins that were induced >2-fold by hypoxic treatment, and correspond to arrows in Figure 2. C, Ratio of hypoxic to normoxic protein synthesis. D, Ratio of anoxic to normoxic protein synthesis in acclimated seedlings. Data for individual labeled proteins in C and D are arranged in the same order as A. Numbered spots in C were identified by MS analysis and are keyed to Table I: 1 and 2, ADH; 3, PDC (inconclusive); 4, actin; 5, GAPC3/4; 6 and 7, GAPC2; 8, GLU1; 9, ADH; 10, malate dehydrogenase precursor. Densities shown are from the gels in Figure 2. Densitometric analysis of three independent replicate experiments with proteins from normoxic and hypoxic root tips gave sd values of ±0.2 for spots of relative intensities between 1 and 4, and sd values of ±0.08 for spots of relative intensities between 0.2 and 0.4.
Figure 4
Figure 4
Effect of cycloheximide (CHX), during hypoxic pretreatment or subsequent anoxia, on protein synthesis and tolerance. Root tips of intact maize seedlings were treated with increasing concentrations of cycloheximide for 1 h prior to and during either 4 h of hypoxia (A and C) or 13 h of anoxia (B and D) (see schematic, “Experimental plan”). Protein synthesis was measured by adding [35S]Met throughout hypoxia (A) and during either the first (▴) or last (▵) 4 h of anoxia (B). Data shown are means ± se. In measurements of root survival (C and D), seedlings were treated sequentially with 4 h of normoxia, 4 h of hypoxia, and 13 h of anoxia, followed by a 26-h normoxic recovery period; cycloheximide was added 1 h prior to and during either 4 h of hypoxia (C) or 13 h of anoxia (D). Cycloheximide was removed at the end of hypoxia (C) and anoxia (D). Growth data are means ± se (n = 10–30); viability data are aggregates of four independent experiments from observations of a total of up to 80 seedlings for each point.
Figure 5
Figure 5
Effect of cycloheximide on cytoplasmic pH regulation during anoxia in acclimated root tips. Seedlings were treated with 4 h of normoxia followed by 4 h of hypoxia, then transferred to NMR sample tubes and subjected to anoxia. Cycloheximide (10 μm) was added either 1 h prior to and during hypoxia (●) or 1 h before and during anoxia (○). Cytoplasmic pH was estimated from the chemical shift of the cytoplasmic 31Pi-NMR resonance (Roberts, 1986).
Figure 6
Figure 6
Effect of cycloheximide on 31P metabolites in root tips of intact seedlings following anoxia. Maize seedlings were treated for 4 h under normoxia and 4 h of hypoxia in funnels, and then transferred to the NMR sample tubes. Spectra were recorded following 13 h of anoxia and approximately 24 h of normoxic recovery. A, No cycloheximide (control). B, Cycloheximide (10 μm) added during the final hour of hypoxia and throughout anoxia, and then removed after anoxia. C, Cycloheximide (10 μm) added 1 h prior to and during hypoxia, and then removed after hypoxia.
Figure 7
Figure 7
Maize root tip proteins analyzed by MS. Figure is a fluorograph of proteins labeled in vivo during normoxia, and separated by two-dimensional IEF-SDS-PAGE (see Fig. 2A). Proteins are ranked and numbered according to the ratio of [35S]Met incorporation under hypoxia relative to normoxia, with 1 being the highest. Results of the MS analysis are presented in Table I using the same numbering scheme.
Figure 8
Figure 8
A, MALDI-DE-TOF peptide mass fingerprint spectrum of a peptide mixture from in-gel tryptic digestion of protein spot 41. Masses labeled on the spectrum are the largest in each isotope cluster. Only the mono-isotopic masses were used for database searches. B, MALDI-TOF-PSD spectrum of a peptide with mass at m/z 1,389.72 from the tryptic digestion of spot 41. PSD spectrum was acquired by selecting the specific peptide from the tryptic mixture by precursor ion gating. Fragment ion masses from this spectrum were used as the fragment ion tag for spot 41 in an MS-Tag database search. The partial amino acid sequence deduced from the fragment ion masses and the mono-isotopic mass of the precursor ion are shown above the spectrum. Peptide backbone cleavage ions associated with charge retention at the N terminus are labeled b, while those with C-terminal charge retention are labeled y (for nomenclature of fragment ions, see Biemann, 1990). T, Trypsin autolytic products. I = 86.04, Y = 136.04, IT-H2O = 196.78, PYF = 408.11.

References

    1. Andrews DL, Cobb BG, Johnson JR, Drew MC. Hypoxic and anoxic induction of alcohol dehydrogenase in roots and shoots of seedlings of Zea mays. Plant Physiol. 1993;101:407–414. - PMC - PubMed
    1. Andrews DL, Drew MC, Johnson JR, Cobb BG. The response of maize seedlings of different ages to hypoxic and anoxic stress. Plant Physiol. 1994a;105:53–60. - PMC - PubMed
    1. Andrews DL, MacAlpine DM, Johnson JR, Kelley PM, Cobb BG, Drew MC. Differential induction of mRNAs for the glycolytic and ethanolic fermentative pathways by hypoxia and anoxia in maize seedlings. Plant Physiol. 1994b;106:1575–1582. - PMC - PubMed
    1. Bandaranayake H, Esen A. Nucleotide sequence of a beta-glucosidase (glu2) cDNA from maize (accession no. U44087) (PGR 96-009) Plant Physiol. 1996;110:1048.
    1. Biemann K. Nomenclature for peptide fragment ions (positive ions) Methods Enzymol. 1990;193:886–887. - PubMed

Publication types

MeSH terms

LinkOut - more resources