. 2000 Feb;122(2):505-16.
doi: 10.1104/pp.122.2.505.

Redox control of psbA gene expression in the cyanobacterium Synechocystis PCC 6803. Involvement of the cytochrome b(6)/f complex

Affiliations

Redox control of psbA gene expression in the cyanobacterium Synechocystis PCC 6803. Involvement of the cytochrome b(6)/f complex

M Alfonso et al. Plant Physiol. 2000 Feb.

Abstract

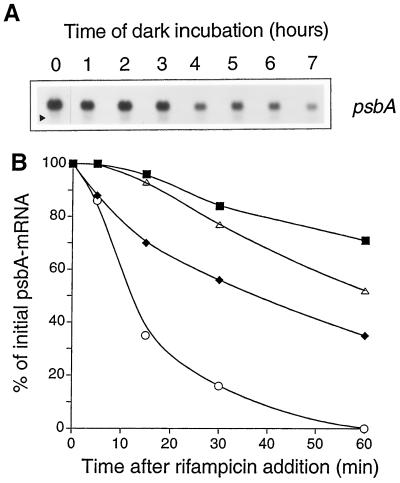
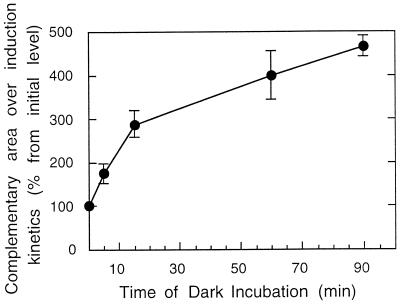
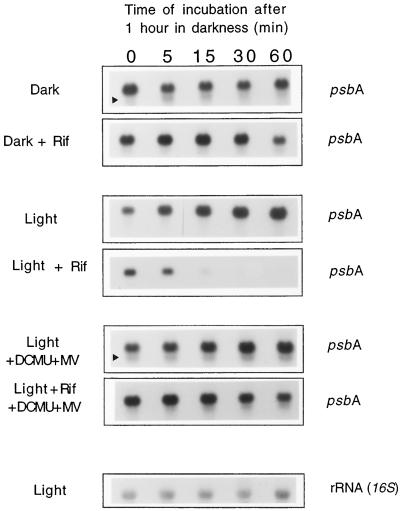
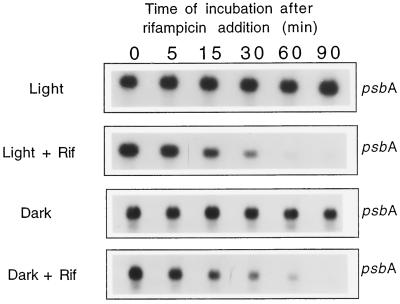
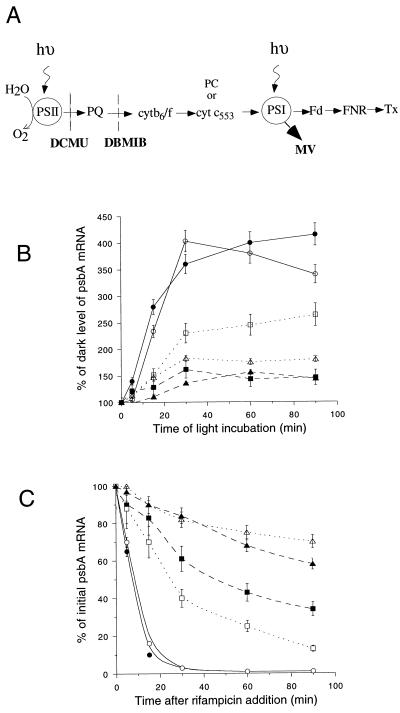
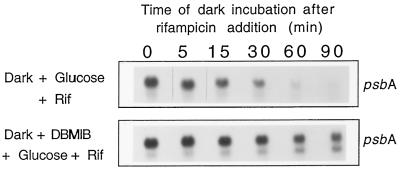
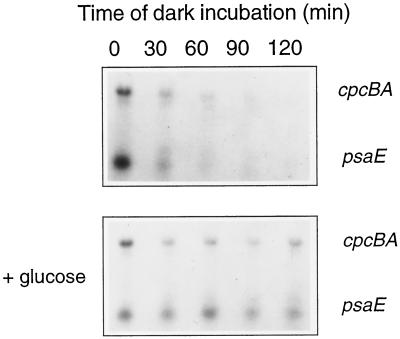
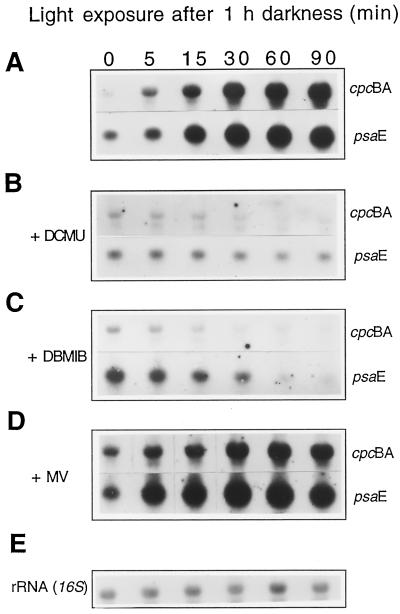
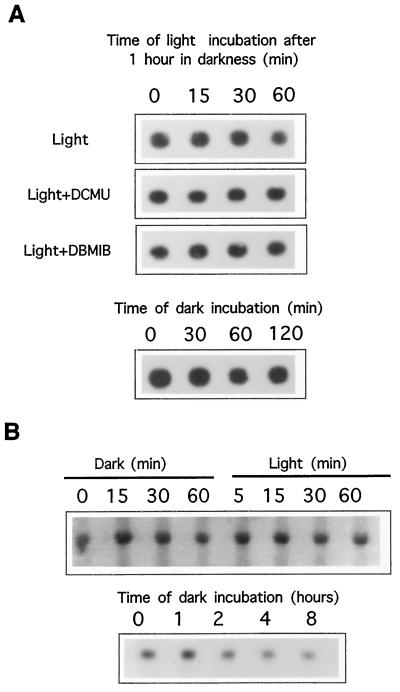
We investigated the role of the redox state of the photosynthetic and respiratory electron transport chains on the regulation of psbA expression in Synechocystis PCC 6803. Different means to modify the redox state of the electron carriers were used: (a) dark to oxidize the whole electron transport chain; (b) a shift from dark to light to induce its reduction; (c) the chemical interruption of the electron flow at different points to change the redox state of specific electron carriers; and (d) the presence of glucose to maintain a high reducing power in darkness. We show that changes in the redox state of the intersystem electron transport chain induce modifications of psbA transcript production and psbA mRNA stability. Reduction of the intersystem electron carriers activates psbA transcription and destabilizes the mRNA, while their oxidation induces a decrease in transcription and a stabilization of the transcript. Furthermore, our data suggest that the redox state of one of the electron carriers between the plastoquinone pool and photosystem I influences not only the expression of the psbA gene, but also that of other two photosynthetic genes, psaE and cpcBA. As a working hypothesis, we propose that the occupancy of the Q(0) site in the cytochrome b(6)/f complex may be involved in this regulation.


Figures

Figure 1
Figure 1
Effect of darkness on the psbA mRNA level and stability. A, psbA transcript level under dark conditions. Low-light-adapted cells (30 μg Chl mL−1) were transferred to dark and samples for RNA isolation were taken at the indicated times. The blots were probed with the psbA probe. B, Rate of degradation of the psbA transcript under dark conditions. Rifampicin was added at the start of dark incubation (♦), and after 30 min (▵) or 120 min of dark incubation (▪). Degradation of the psbA transcript under low-light conditions (○) is also shown. Data were obtained by densitometry of the autoradiograms from two independent experiments. The position of the 0.9-kb truncated psbA transcript is indicated by the arrow.
Figure 2
Figure 2
Kinetics of PQ reoxidation during dark incubation expressed as increase of the complementary area over the induction fluorescence curve in the presence of DBMIB. Low-light-adapted cells were transferred to darkness in the absence of inhibitors. Samples were taken after 1, 5, 15, 60, and 90 min of dark incubation. At each time, the cells were diluted to 2 μg Chl mL−1 and fluorescence induction curves were monitored upon addition of DBMIB alone or DBMIB plus DCMU to determine the Fm level. The area between the induction curve in the presence of DBMIB alone and that in the presence of DBMIB plus DCMU was calculated for each time. Data from three independent experiments were averaged and normalized to the initial area obtained at time 0 of dark incubation; n = 3 ± se.
Figure 3
Figure 3
Northern-blot analysis of the psbA transcript levels after the transfer of dark-adapted cells to low-light conditions in the absence and presence of photosynthetic electron transport inhibitors. Cells (15 μg Chl mL−1) were preincubated for 1 h in darkness. The cells were then left in darkness or illuminated in the absence or presence of rifampicin, in the absence of photosynthetic inhibitors, or in the presence of DCMU (20 μm) plus MV (300 μm). Total RNA isolated from cells left in darkness or illuminated for 0, 5, 15, 30, and 60 min was separated on agarose-formaldehyde gels (10 μg per lane), transferred onto a nylon membrane, and hybridized with the psbA probe. Then 16S rRNA was always used as loading control. The membrane used in the light experiment without inhibitors, dehybridized, and probed with a SmaI-PstI fragment containing the 16S rRNA gene is shown in the figure. The position of the 0.9-kb truncated psbA transcript is indicated by the arrow.
Figure 4
Figure 4
Effect of Glc on psbA transcript levels and psbA mRNA stability. Synechocystis PCC 6803 cells were adapted to grow in the presence of Glc for at least five generations. Cells (30 μg Chl mL−1) were resuspended in a Glc-containing medium, incubated for 1 h under light or dark conditions, and then maintained in darkness or light in the absence or presence of rifampicin. RNA was isolated at the indicated times. Time 0 coincided with 1 h of dark or light incubation. Blots were hybridized with the psbA probe.
Figure 5
Figure 5
Relative levels of psbA transcript and psbA mRNA stability after cell transfer from dark to light in the absence and presence of photosynthetic electron transport inhibitors. A, Schematic representation of the action sites of the different chemicals used in this study. PC, Plastocyanin; Fd, ferredoxin; FNR, ferredoxin-NADH-reductase; Tx, thioredoxin. B, Quantification of steady-state psbA transcript levels following cell transfer from dark to light in the absence or presence of photosynthetic electron transport inhibitors. For experimental conditions, see “Materials and Methods.” C, Rate of disappearance of the psbA transcript in the presence of rifampicin after the shift from dark to light. Rifampicin was added at time 0, which coincided with the time of the shift to light. ●, No inhibitors; ○, with 2 mm MV; □, DCMU (20 μm) alone; ▪, DBMIB (20 μm) alone; ▵, DCMU (20 μm) plus MV (300 μm); ▴, DBMIB (15 μm) plus MV (300 μm). The average of three separate experiments is shown. Data were obtained by densitometry of autoradiograms.
Figure 6
Figure 6
Effect of DBMIB on psbA mRNA stability. Glc-grown Synechocystis PCC 6803 cells (30 μg Chl mL−1) were resuspended in a Glc-containing medium and incubated for 1 h under dark conditions in the presence or absence of DBMIB (20 μm). Rifampicin was then added and the cells were maintained in darkness. RNA was isolated at the indicated times. Time 0 coincided with 1 h of dark incubation. Blots were hybridized with the psbA probe.
Figure 7
Figure 7
Effect of darkness on psaE and cpcBA transcript levels. Cells were grown in the absence or presence of Glc. Low-light-adapted cells (30 μg Chl mL−1) were transferred to dark in the absence or presence of Glc and samples for RNA isolation were taken at the indicated times. Blots were hybridized with the cpcBA probe and the psaE probe. The sizes of psaE and cpcBA transcripts were determined to be 0.35 and 1.6 kb, respectively.
Figure 8
Figure 8
Effect of photosynthetic electron transport inhibitors on psaE and cpcBA transcript accumulation following the shift of cells from dark to light. Northern-blot analysis of psaE and cpcBA transcript levels after the transfer of dark-adapted cells to light conditions. Cells were preincubated for 1 h in darkness and then illuminated in the absence (A) or presence of the photosynthetic inhibitors DCMU (20 μm) (B), DBMIB (20 μm) (C), or MV (2 mm) (D). Samples for RNA isolation were taken at the indicated times. Blots were hybridized with the psaE and the cpcBA probes. 16S rRNA was always used as loading control. The membrane used in experiment A dehybridized and probed with a SmaI-PstI fragment containing the 16S rRNA gene is shown in E.
Figure 9
Figure 9
Behavior of rnpB and trpA mRNAS under light and dark conditions. A, Effect of DCMU and DBMIB northern-blot analysis of rnpB transcript level after the transfer of dark-adapted cells to light conditions. Cells were preincubated for 1 h in darkness, and then illuminated in the absence or presence of DCMU (20 μm) or DBMIB (20 μm). The levels of the rnpB transcript during the dark incubation are also shown. B, trpA transcript levels under dark conditions and after the transfer of dark-adapted cells to light conditions.

Similar articles

Cited by

References

    1. Ajlani G, Kirilovsky D, Picaud M, Astier C. Molecular analysis of psbA mutations responsible for various herbicide resistance phenotypes in Synechocystis 6714. Plant Mol Biol. 1989;13:469–479. - PubMed
    1. Alfonso M, Perewoska I, Constant S, Kirilovsky D. Redox control of psbA expression in cyanobacterium Synechocystis strains. J Photochem Photobiol B Biol. 1999;48:104–113.
    1. Allen JF. Redox control of transcription: sensors, response regulators and repressors. FEBS Lett. 1993;323:203–207. - PubMed
    1. Aoki M, Katoh S. Size of the plastoquinone pool in photosynthetic and respiratory electron transport of Synechococcus sp. Plant Cell Physiol. 1983;24:1379–1386.
    1. Aro EM, Virgin I, Andersson B. Photoinhibition of PS II: inactivation, protein damage and turnover. Biochim Biophys Acta. 1993;1143:113–134. - PubMed

Publication types