

Metabolic dysfunction and unabated respiration precede the loss of membrane integrity during dehydration of germinating radicles
- PMID: 10677452
- PMCID: PMC58896
- DOI: 10.1104/pp.122.2.597
Metabolic dysfunction and unabated respiration precede the loss of membrane integrity during dehydration of germinating radicles
Abstract
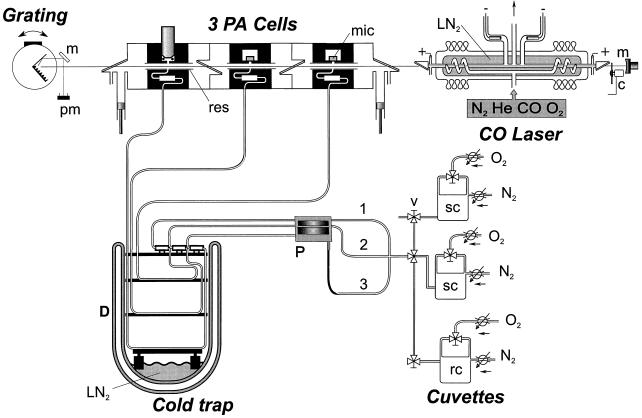
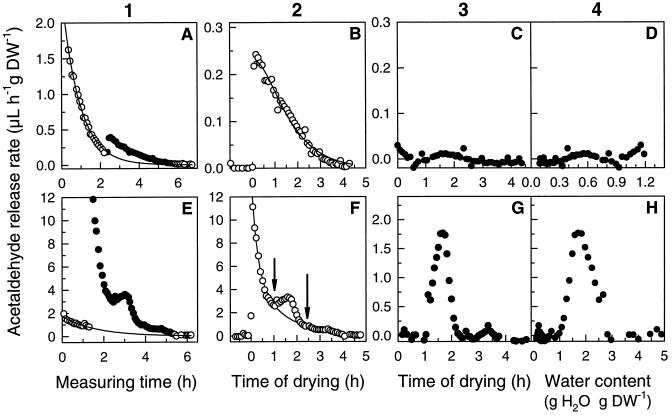
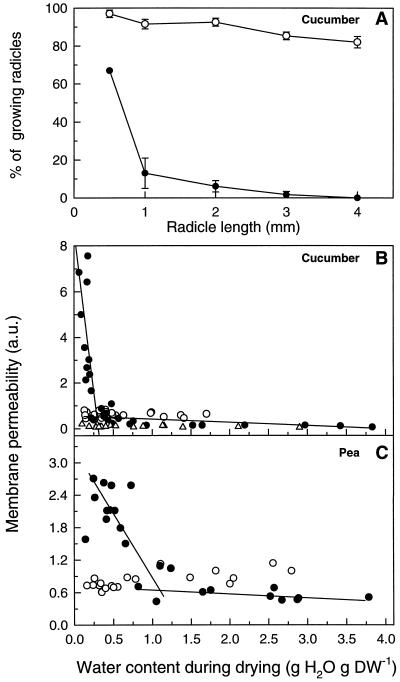
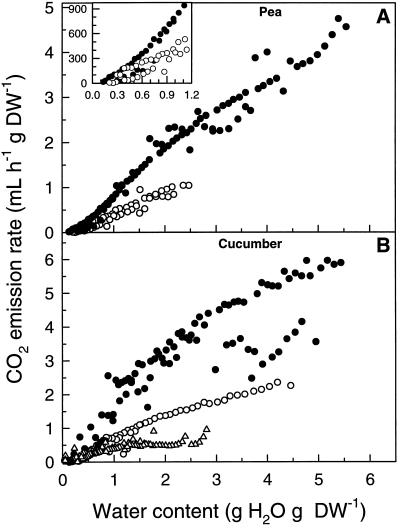
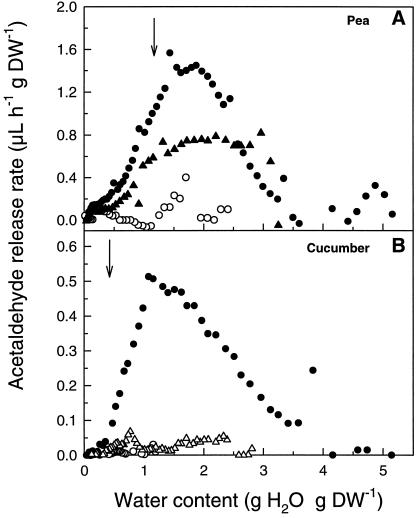
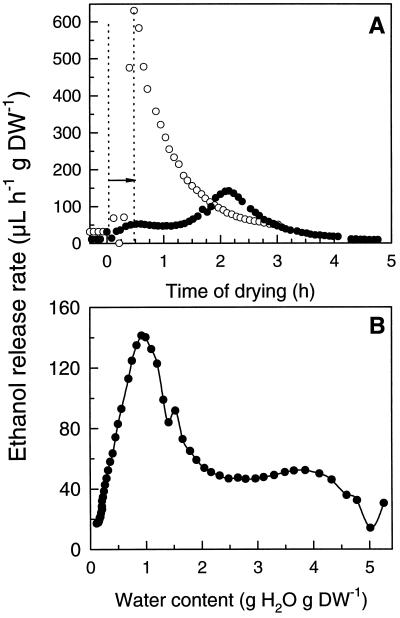
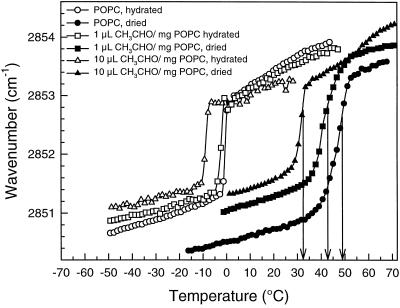
This study shows that dehydration induces imbalanced metabolism before loss of membrane integrity in desiccation-sensitive germinated radicles. Using a photoacoustic detection system, responses of CO(2) emission and fermentation to drying were analyzed non-invasively in desiccation-tolerant and -intolerant radicles of cucumber (Cucumis sativa) and pea (Pisum sativum). Survival after drying and a membrane integrity assay showed that desiccation tolerance was present during early imbibition and lost in germinated radicles. However, tolerance could be re-induced in germinated cucumber radicles by incubation in polyethylene glycol before drying. Tolerant and polyethylene glycol (PEG)-induced tolerant radicles exhibited a much-reduced CO(2) production before dehydration compared with desiccation-sensitive radicles. This difference was maintained during dehydration. In desiccation-sensitive tissues, dehydration induced an increase in the emission of acetaldehyde and ethanol that peaked well before the loss of membrane integrity. Acetaldehyde emission from sensitive radicles was significantly reduced when dehydration occurred in 50% O(2) instead of air. Acetaldehyde/ethanol were not detected in dehydrating tolerant radicles of either species or in polyethylene glycol-induced tolerant cucumber radicles. Thus, a balance between down-regulation of metabolism during drying and O(2) availability appears to be associated with desiccation tolerance. Using Fourier transform infrared spectroscopy, acetaldehyde was found to disturb the phase behavior of phospholipid vesicles, suggesting that the products resulting from imbalanced metabolism in seeds may aggravate membrane damage induced by dehydration.
Figures
Similar articles
-
Dehydration-induced redistribution of amphiphilic molecules between cytoplasm and lipids is associated with desiccation tolerance in seeds.Plant Physiol. 2000 Nov;124(3):1413-26. doi: 10.1104/pp.124.3.1413. Plant Physiol. 2000. PMID: 11080316 Free PMC article.
-
NMR metabolite profiling analysis reveals changes in phospholipid metabolism associated with the re-establishment of desiccation tolerance upon osmotic stress in germinated radicles of cucumber.Plant Cell Environ. 2006 Apr;29(4):471-82. doi: 10.1111/j.1365-3040.2005.01424.x. Plant Cell Environ. 2006. PMID: 17080600
-
Proteomic Analysis of Desiccation Tolerance and Its Re-Establishment in Different Embryo Axis Tissues of Germinated Pea Seeds.J Proteome Res. 2021 May 7;20(5):2352-2363. doi: 10.1021/acs.jproteome.0c00860. Epub 2021 Mar 19. J Proteome Res. 2021. PMID: 33739120
-
Induction of desiccation tolerance in plant somatic embryos: how exclusive is the protective role of sugars?Cryobiology. 2001 Sep;43(2):140-50. doi: 10.1006/cryo.2001.2358. Cryobiology. 2001. PMID: 11846469 Review.
-
The role of amphiphiles.Comp Biochem Physiol A Mol Integr Physiol. 2002 Mar;131(3):527-33. doi: 10.1016/s1095-6433(01)00504-9. Comp Biochem Physiol A Mol Integr Physiol. 2002. PMID: 11867278 Review.
Cited by
-
Online, real-time detection of volatile emissions from plant tissue.AoB Plants. 2013;5:plt003. doi: 10.1093/aobpla/plt003. Epub 2013 Feb 20. AoB Plants. 2013. PMID: 23429357 Free PMC article.
-
A comprehensive study on dehydration-induced antioxidative responses during germination of Indian bread wheat (Triticum aestivum L. em Thell) cultivars collected from different agroclimatic zones.Physiol Mol Biol Plants. 2012 Jul;18(3):217-28. doi: 10.1007/s12298-012-0117-7. Physiol Mol Biol Plants. 2012. PMID: 23814436 Free PMC article.
-
Effects of Inorganic Salt Solutions on Vigour, Viability, Oxidative Metabolism and Germination Enzymes in Aged Cabbage and Lettuce Seeds.Plants (Basel). 2020 Sep 9;9(9):1164. doi: 10.3390/plants9091164. Plants (Basel). 2020. PMID: 32916793 Free PMC article.
-
Volatile fingerprints of seeds of four species indicate the involvement of alcoholic fermentation, lipid peroxidation, and Maillard reactions in seed deterioration during ageing and desiccation stress.J Exp Bot. 2012 Nov;63(18):6519-30. doi: 10.1093/jxb/ers307. J Exp Bot. 2012. PMID: 23175670 Free PMC article.
-
Orthodoxy, recalcitrance and in-between: describing variation in seed storage characteristics using threshold responses to water loss.Planta. 2015 Aug;242(2):397-406. doi: 10.1007/s00425-015-2312-6. Epub 2015 May 19. Planta. 2015. PMID: 25985842 Review.
References
-
- Bruggink T, van der Toorn P. Induction of desiccation tolerance in germinated seeds. Seed Sci Res. 1995;5:1–4.
-
- Cross AR, Jones OTG. Enzymic mechanisms of superoxide production. Biochim Biophys Acta. 1991;1057:281–298. - PubMed
-
- Drew MC. Oxygen deficiency and root metabolism: injury and acclimation under hypoxia and anoxia. Annu Rev Plant Physiol Plant Mol Biol. 1997;48:223–250. - PubMed
Publication types
MeSH terms
Substances
LinkOut - more resources
Full Text Sources
