Climate and infectious disease: use of remote sensing for detection of Vibrio cholerae by indirect measurement
- PMID: 10677480
- PMCID: PMC26452
- DOI: 10.1073/pnas.97.4.1438
Climate and infectious disease: use of remote sensing for detection of Vibrio cholerae by indirect measurement
Abstract
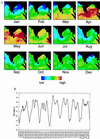
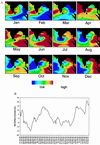
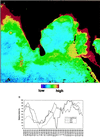
It has long been known that cholera outbreaks can be initiated when Vibrio cholerae, the bacterium that causes cholera, is present in drinking water in sufficient numbers to constitute an infective dose, if ingested by humans. Outbreaks associated with drinking or bathing in unpurified river or brackish water may directly or indirectly depend on such conditions as water temperature, nutrient concentration, and plankton production that may be favorable for growth and reproduction of the bacterium. Although these environmental parameters have routinely been measured by using water samples collected aboard research ships, the available data sets are sparse and infrequent. Furthermore, shipboard data acquisition is both expensive and time-consuming. Interpolation to regional scales can also be problematic. Although the bacterium, V. cholerae, cannot be sensed directly, remotely sensed data can be used to infer its presence. In the study reported here, satellite data were used to monitor the timing and spread of cholera. Public domain remote sensing data for the Bay of Bengal were compared directly with cholera case data collected in Bangladesh from 1992-1995. The remote sensing data included sea surface temperature and sea surface height. It was discovered that sea surface temperature shows an annual cycle similar to the cholera case data. Sea surface height may be an indicator of incursion of plankton-laden water inland, e.g., tidal rivers, because it was also found to be correlated with cholera outbreaks. The extensive studies accomplished during the past 25 years, confirming the hypothesis that V. cholerae is autochthonous to the aquatic environment and is a commensal of zooplankton, i.e., copepods, when combined with the findings of the satellite data analyses, provide strong evidence that cholera epidemics are climate-linked.
Figures


References
-
- Pollitzer R. Cholera. Geneva: World Health Organization; 1959. pp. 11–50.
-
- Colwell R R. Science. 1996;274:2025–2031. - PubMed
-
- Epstein P R, Ford T E, Colwell R R. Lancet. 1993;342:1216–1219. - PubMed
-
- Patz J A, Epstein P R, Burke T A, Balbus J M. J Am Med Assoc. 1996;275:217–223. - PubMed
-
- Kiorboe T, Neilson T J. Limnol Oceanogr. 1994;39:493–507.
Publication types
MeSH terms
Substances
Grants and funding
LinkOut - more resources
Full Text Sources
Medical
Miscellaneous

