. 2000 Feb 15;97(4):1938-43.
doi: 10.1073/pnas.97.4.1938.

The epidemiology of antibiotic resistance in hospitals: paradoxes and prescriptions

Affiliations

The epidemiology of antibiotic resistance in hospitals: paradoxes and prescriptions

M Lipsitch et al. Proc Natl Acad Sci U S A. .

Abstract

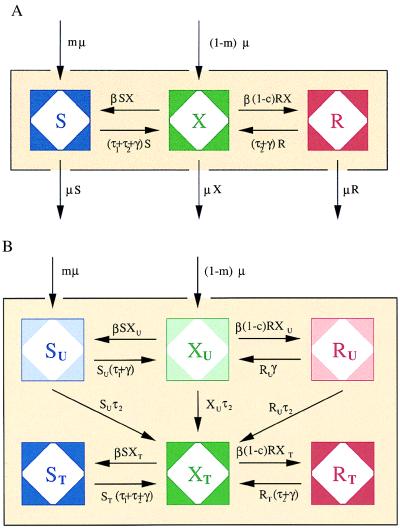
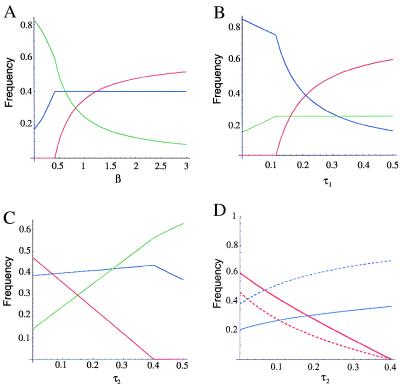
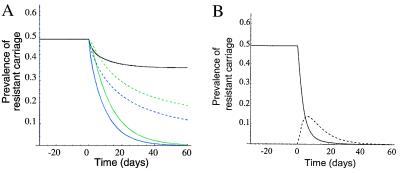
A simple mathematical model of bacterial transmission within a hospital was used to study the effects of measures to control nosocomial transmission of bacteria and reduce antimicrobial resistance in nosocomial pathogens. The model predicts that: (i) Use of an antibiotic for which resistance is not yet present in a hospital will be positively associated at the individual level (odds ratio) with carriage of bacteria resistant to other antibiotics, but negatively associated at the population level (prevalence). Thus inferences from individual risk factors can yield misleading conclusions about the effect of antibiotic use on resistance to another antibiotic. (ii) Nonspecific interventions that reduce transmission of all bacteria within a hospital will disproportionately reduce the prevalence of colonization with resistant bacteria. (iii) Changes in the prevalence of resistance after a successful intervention will occur on a time scale of weeks to months, considerably faster than in community-acquired infections. Moreover, resistance can decline rapidly in a hospital even if it does not carry a fitness cost. The predictions of the model are compared with those of other models and published data. The implications for resistance control and study design are discussed, along with the limitations and assumptions of the model.


Figures

Figure 1
Figure 1
(A) A compartment model of antibiotic-resistance in a hospital setting. See text for description and equations. (B) The extended model, in which patients are tracked by their treatment history (see text). Individuals are discharged at a constant rate μ from all compartments (not shown). For brevity, S = ST + SU; X = XT + XU; r = RT +RU.
Figure 2
Figure 2
Equilibrium prevalence of sensitive and resistant bacterial carriage predicted by the model, as a function of treatment and transmission variables. Equilibrium prevalences are given by: formula image Sensitives are shown in blue; resistants in red; and uncolonized individuals in green. (A) Increased within-hospital transmission rates (β) increase the prevalence of sensitive bacteria, up to the threshold (given by Eq. 1) at which resistant bacteria are able to invade and persist endemically. Further increases in transmission rates increase the prevalence of resistant bacterial carriage but have no effect on the prevalence of carriage of sensitive bacteria. Thus, interventions to reduce transmission, such as barrier precautions and hand washing, are most likely to reduce carriage of resistant bacteria before they reduce carriage of sensitive, if they affect sensitive carriage at all. (B) Increased levels of treatment with drug 1 (τ1) result in higher prevalence of bacteria resistant to it and lower prevalence of sensitive bacteria. (C) Increased treatment with drug 2 (τ2) reduces prevalence of bacteria resistant to drug 1 but increases the prevalence of sensitives, up to the point at which resistants have been driven extinct; thereafter, it reduces the prevalence of sensitives. (D) Individuals treated with drug 2 are at higher risk of carriage of drug 1-resistant bacteria at equilibrium, although increased total use of drug 2 (τ2) reduces prevalence of drug 1-resistant carriage. Shown are prevalences of sensitive (blue) and resistant (red) bacteria in individuals who have been treated with drug 2 (solid curves) and those who have not (dashed curves). Parameters (except when parameter is varied along x-axis): β = 1.0/day, c = 0.05, μ = 1/(10 days), γ = 1/(30 days), m = 0.75, τ1 = 1/(5 days), τ2 = 1/(10 days).
Figure 3
Figure 3
The prevalence of carriage of bacteria resistant to drug 1 changes rapidly over the weeks after changes in hospital practice (at day 0), starting from an equilibrium where only drug 1 was being used. Parameters: μ = 1/(10 days), γ = 1/(30 days), m = 0.75, c = 0. Before day 0: β = 1/day, τ 1 = 1/(5 days), τ2 = 0. (A) Effects of reducing transmission rates (β) by 30% (black curve), reducing the use of drug 1 (τ1) (green curves) by 50% (dashed) or 100% (solid), or replacing 50% (dashed) or 100% (solid) of use of drug 1 by use of drug 2 (blue curves). Addition of drug 2 makes the decline in resistance to drug 1 faster and larger than reduction of drug 1 alone. (B) Carriage of resistance to drug 1 after a switch from use of drug 1 only to use of drug 2 only (same as solid blue curve), in individuals who have (dashed curve) and have not (solid curve) received drug 2. After about 7 days, drug 2 treatment becomes a risk factor for drug 1 resistance, even though use of drug 2 is aiding in the reduction of resistance to drug 1 in the hospital.

References

    1. Gaynes R, Monnet D. Ciba Found Symp. 1997;207:47–56. ; discussion 56–60. - PubMed
    1. Monnet D L, Archibald L K, Phillips L, Tenover F C, McGowan J E, Jr, Gaynes R P. Infect Control Hosp Epidemiol. 1998;19:388–394. - PubMed
    1. Bonten M J, Weinstein R A. Infect Control Hosp Epidemiol. 1996;17:193–200. - PubMed
    1. Gaynes R P, Weinstein R A, Smith J, Carman M, Kabins S A. Infect Control. 1983;4:221–224. - PubMed
    1. Slaughter S, Hayden M K, Nathan C, Hu T C, Rice T, Van Voorhis J, Matushek M, Franklin C, Weinstein R A. Ann Intern Med. 1996;125:448–456. - PubMed

Publication types

Substances