. 2000 Feb;11(2):497-510.
doi: 10.1091/mbc.11.2.497.

Nuclear pre-mRNA compartmentalization: trafficking of released transcripts to splicing factor reservoirs

Affiliations
Free PMC article

Nuclear pre-mRNA compartmentalization: trafficking of released transcripts to splicing factor reservoirs

I Melcák et al. Mol Biol Cell. 2000 Feb.
Free PMC article

Abstract

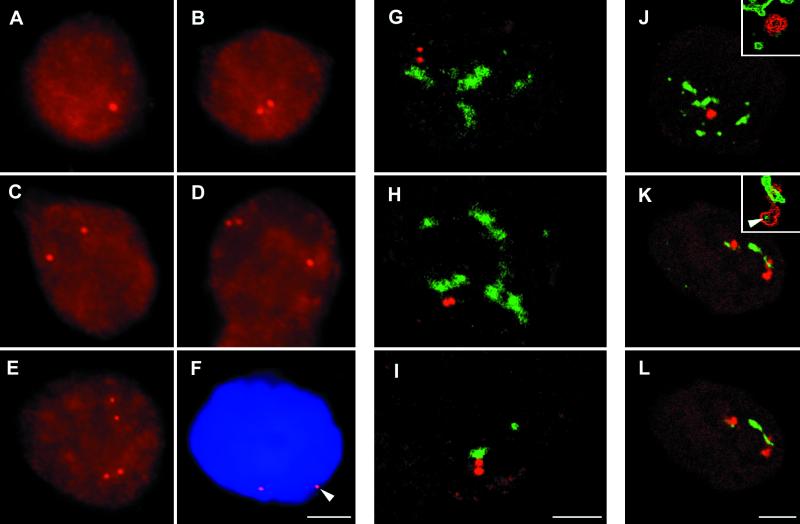
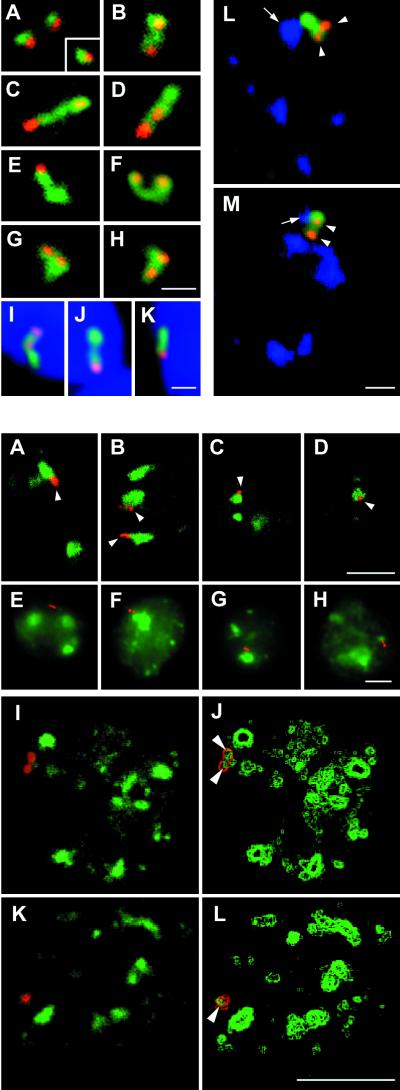
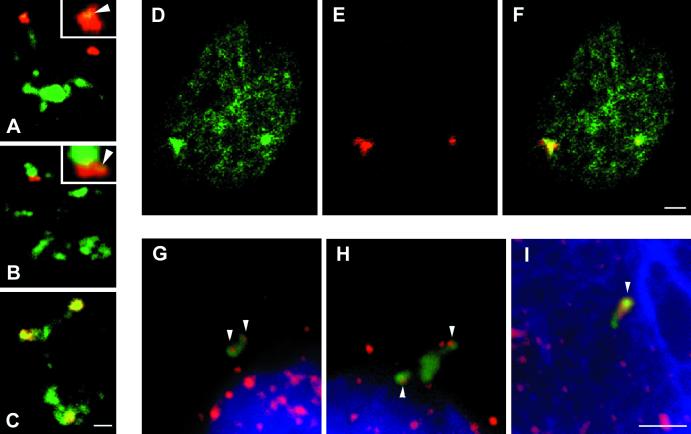
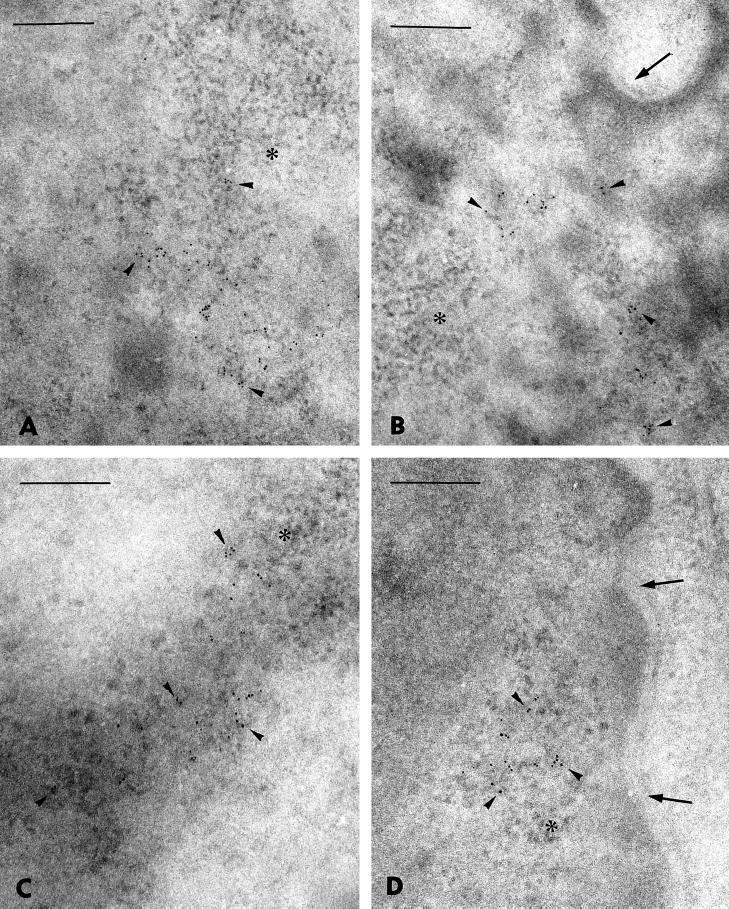
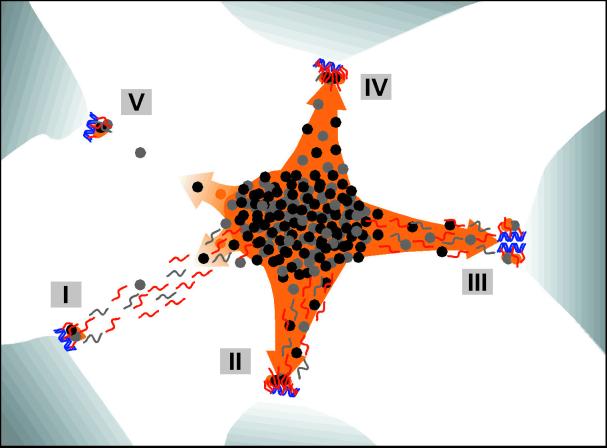
In the present study, the spatial organization of intron-containing pre-mRNAs of Epstein-Barr virus (EBV) genes relative to location of splicing factors is investigated. The intranuclear position of transcriptionally active EBV genes, as well as of nascent transcripts, is found to be random with respect to the speckled accumulations of splicing factors (SC35 domains) in Namalwa cells, arguing against the concept of the locus-specific organization of mRNA genes with respect to the speckles. Microclusters of splicing factors are, however, frequently superimposed on nascent transcript sites. The transcript environment is a dynamic structure consisting of both nascent and released transcripts, i.e., the track-like transcript environment. Both EBV sequences of the chromosome 1 homologue are usually associated with the track, are transcriptionally active, and exhibit in most cases a polar orientation. In contrast to nascent transcripts (in the form of spots), the association of a post-transcriptional pool of viral pre-mRNA (in the form of tracks) with speckles is not random and is further enhanced in transcriptionally silent cells when splicing factors are sequestered in enlarged accumulations. The transcript environment reflects the intranuclear transport of RNA from the sites of transcription to SC35 domains, as shown by concomitant mapping of DNA, RNA, and splicing factors. No clear vectorial intranuclear trafficking of transcripts from the site of synthesis toward the nuclear envelope for export into the cytoplasm is observed. Using Namalwa and Raji cell lines, a correlation between the level of viral gene transcription and splicing factor accumulation within the viral transcript environment has been observed. This supports a concept that the level of transcription can alter the spatial relationship among intron-containing genes, their transcripts, and speckles attributable to various levels of splicing factors recruited from splicing factor reservoirs. Electron microscopic in situ hybridization studies reveal that the released transcripts are directed toward reservoirs of splicing factors organized in clusters of interchromatin granules. Our results point to the bidirectional intranuclear movement of macromolecular complexes between intron-containing genes and splicing factor reservoirs: the recruitment of splicing factors to transcription sites and movement of released transcripts from DNA loci to reservoirs of splicing factors.


Figures

Figure 1
Figure 1
Organization of EBV genomes (A–F) and relationship between SC35 domains and viral DNA (G–I) or RNA (J–L) in Namalwa cells. The pattern of viral genomes distribution in the interphase nuclei of Namalwa cell has been established by DNA FISH of major internal repeat BamHI W. In 34% of cells, a single dot is observed (A). In 48% of cells, two dots closely spaced within the whole range of ∼3 μm in the x–y plane of each other are observed (B). Seventeen percent of cells have duplicated patterns in three combinations (C–E). A part of the second cell is seen in the bottom part of D. Spatial localization of viral genomes in the interphase nuclei has been performed by means of DNA FISH and DAPI staining. The majority of the signal spatially separated from the nuclear periphery; the minority of genomes have a more peripheral nuclear localization; and some dots are close to nuclear periphery (F, arrowhead). The spatial relationship (documented here by confocal sections) between viral DNA sequences and SC35 domains has been performed by DNA FISH and immunocytochemical mapping by means of the antibody to SC35 splicing factor. In the majority of cells, DNA sequences (red) are observed exclusively outside of the SC35 domains (green; G and I). A smaller fraction of DNA loci, and just one locus in the case of the doublet, is found associated with the outer edge of the SC35 domain (I). Spatial relationship (documented here by confocal sections) between EBV pre-mRNA (red) and SC35 domains (green) has been established by means of RNA FISH and immunocytochemistry. Basically two categories of distribution are observed in the Namalwa cell line. The first category comprises viral RNA spatially separated from SC35 domains (J; the spatial separation is well seen in the inset). The second category includes RNA tightly associated with SC35 domains. This is the major fraction of RNAs forming tracks. RNA signal exhibits various extents of overlap with the SC35 domain (K). The microcluster(s) of SC35 at the pole of RNA accumulations, opposite the SC35 domain, have been observed (K, inset, arrowhead). Insets represent edge-filtered images. K and L are two consecutive confocal sections. Bars, 4.5 μm.
Figure 3
Figure 3
Visualization of the post-transcriptional pool of viral RNA and gene loci in transcriptionally inhibited Namalwa cells and of nascent transcripts in Namalwa cells after resumption of RNA synthesis. Visualization of the post-transcriptional pool of viral RNA (A–D; confocal sections) or gene loci (E–H; conventional fluorescence) and their relationship to SC35 domains is documented. RNA pol II transcription has been inhibited by 50 μg/ml DRB for various periods. The RNA pol II inhibition of transcription caused sequestration of splicing factors in enlarged and rounded-up SC35 domains (green). After 3 h of incubation of cells with DRB, 86% of 93 RNA accumulations (red) are associated with SC35 domains (A and B), and the tracks are generally shorter than in nontreated cells. After an additional 3.5 h of treatment with DRB, the length of the tracks is progressively shortened further, whereas their association with SC35 domains is increased to 96% for the 75 RNA signals analyzed (Figure 3, C and D). However, DNA loci (red) are distributed randomly relative to splicing factor domains within the whole nuclei (Figure 3, E–H). Visualization of nascent viral RNA (red) after a release of cells from the transcriptional block is documented in confocal sections (Figure 3, I–L). The nuclear pool of viral RNA has been depleted by DRB incubation for 13.5 h. The cells were removed from the transcriptional block by replacing the medium and incubated 15 min for recovery. Splicing factors (green) redistributed to a normal speckled pattern (I and K). The vast majority of cells exhibited a single spot (I) or a double spot (3K) of RNA accumulation (red) similar to the gene pattern. RNA spots were spatially separated from the SC35 domains (I and K). The local accumulations of splicing factors (arrowheads) associated with nascent transcripts are seen in the corresponding edge filter images (J and L). Bars: A–K, 6 μm; I–L, 8 μm.
Figure 4
Figure 4
Relationship between viral RNAs and SC35 domains in Raji cells and relationship among viral RNA transcript environment, visualization of nuclear domains enriched in hnRNP K/J proteins, and visualization of transcription sites in the EBV transcript environment (depicted by hnRNP K/J protein immunolabeling). The approach exploring RNA FISH (red) and immunocytochemistry has been used to establish the relationship between viral RNAs and SC35 domains in Raji cells (A–C). In most cells, one to three RNA accumulations are observed. With respect to SC35 domains, RNA signals fall within three categories. As in Namalwa cells, viral RNA is localized as either spatially distinct (A) or associated with SC35 domains (B). However, in contrast to Namalwa cells (see Figure 1), RNA accumulations inside the speckle domains are often found (C). The microclusters of splicing factors distinct from the SC35 domains at the pole of RNA accumulation are clearly visible (insets, arrowheads). By means of RNA FISH and immunocytochemistry, hnRNP K/J proteins (D, green) have been shown to be highly enriched at accumulations of viral RNA (red) in transcriptionally active Raji and Namalwa cells (E). The overlay is documented in F. This fact has been used for the localization of transcription sites at viral RNA accumulations. Visualization of transcription sites (red) in the EBV transcript environment (green) is also shown. Nuclei have been spread by osmotic shift and allowed to transcribe de novo in the presence of modified nucleotides. RNA pol II transcriptional competence has been restored by HeLa nuclear extract. Because of a highly diluted nuclear content, single sites of transcription (G–I, red) are easily distinguished. The hnRNP K/J site (K/J site), which colocalizes with the EBV transcript environment (F), is not disrupted by this method (G–I, green). One or two sites of transcription (active genes) are found in the majority of K/J sites of Namalwa spread nuclei (G and H, arrowheads). Sites of transcription colocalize with the K/J site and are of various size, usually much larger in Raji spread cells (I, arrowhead) than in Namalwa cells. Bars, 2 μm.
Figure 5
Figure 5
EM localization of viral RNA in nuclei of Namalwa (A and B) and Raji (C and D) cells. By means of postembedding RNA ISH, most of the visualized RNA (6-nm gold particles; arrowheads) are observed in fibrillogranular structures belonging to PFs. A few gold particles (A, C, and D) are found at the border and/or slightly engulfed in clusters of interchromatin granules (asterisk). Note a more pronounced fine structural heterogeneity of PFs observed in Raji cells than in Namalwa cells. For RNA accumulations found at the outermost nuclear region (B and D), the gold particles are not associated with the nuclear envelope (nuclear pores). Bars, 500 nm.
Figure 6
Figure 6
Explanatory sketch of the patterns for genes, transcripts, and splicing factors. Blue helices, genes; red and gray segments, RNA; black, gray, and orange dots, splicing factors; orange area, speckle; orange arrows, recruitment of splicing factors; concentrated dots in the center with the overall ellipsoidal shape, IGC; dots and the gray segments outside of the IGC, PFs. Blue, red, and orange correspond to fluorescence images; EM is in grayscale. (I) Transcription is moderate (or even high), and co-transcriptional splicing is at a low or moderate level. The recruitment of splicing factors is relatively low; much of the unprocessed pre-mRNA is trafficking to IGC. Here, the RNA trafficking clearly prevails over the recruitment of splicing factors, and visualized RNA tracks are associated with the splicing factor reservoirs as observed in Namalwa cells. (II) Example similar to the previous case, but co-transcriptional splicing prevails. There is an elevated recruitment of splicing factors, and (most of) the visualized RNA (RNA tracks) becomes part of the speckle. The corresponding gene becomes associated with the speckle. (III) Example of the local site of high transcriptional activity (depicted here from the clustered genes) and both co- and post-transcriptional splicing. The splicing factors are highly recruited, and both the RNA (as observed in Raji cells) and the genes are extensively engulfed in the speckle. This example is similar to II. (IV) Example of a highly transcribed gene, high recruitment of splicing factors, and co-transcriptional splicing only. Both the RNA (as a spot) and the gene are associated with the speckle. This pattern has been observed rarely in the present study. (V) Example of an endogenous gene expressed at a low level. Transcription is low, as is the recruitment of splicing factors. Visualized RNA appears as a spot at the site of transcription (because of relatively elevated local RNA accumulation), and any directed movement of released RNA is below the level of detection. However, this situation also corresponds to the expressed genes after resumption of RNA synthesis, as seen after DRB treatment of Namalwa cells in this study.

Similar articles

Cited by

References

    1. Aspegren A, Rabino C, Bridge E. Organization of splicing factors in adenovirus-infected cells reflects changes in gene expression during the early to late phase transition. Exp Cell Res. 1998;245:203–213. - PubMed
    1. Baurén G, Wieslander L. Splicing of Balbiani ring 1 gene pre-mRNA occurs simultaneously with transcription. Cell. 1994;76:183–192. - PubMed
    1. Bendayan M, Nanci A, Kan FWK. Effect of tissue processing on colloidal gold cytochemistry. J Histochem Cytochem. 1987;35:983–996. - PubMed
    1. Beyer AL, Osheim YN. Splice site selection, rate of splicing, and alternative splicing on nascent transcripts. Genes Dev. 1988;2:754–765. - PubMed
    1. Blencowe BJ, Nickerson JA, Issner R, Penman S, Sharp PA. Association of nuclear matrix antigens with exon-containing splicing complexes. J Cell Biol. 1994;127:593–607. - PMC - PubMed

Publication types

MeSH terms