. 2000 Feb;9(2):81-92.
doi: 10.1002/(sici)1097-0193(200002)9:2<81::aid-hbm3>3.0.co;2-8.

Mathematical/computational challenges in creating deformable and probabilistic atlases of the human brain

Affiliations

Mathematical/computational challenges in creating deformable and probabilistic atlases of the human brain

P M Thompson et al. Hum Brain Mapp. 2000 Feb.

Abstract

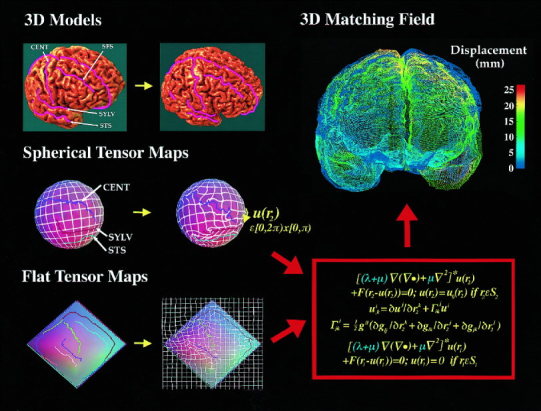
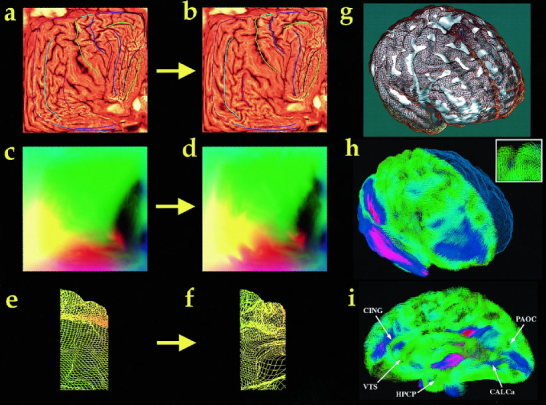
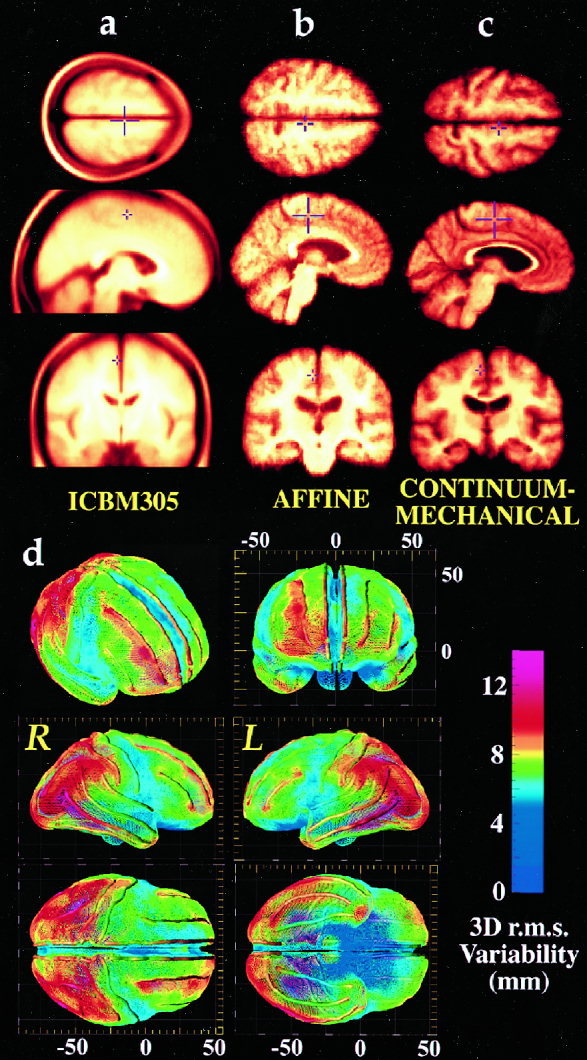
Striking variations in brain structure, especially in the gyral patterns of the human cortex, present fundamental challenges in human brain mapping. Probabilistic brain atlases, which encode information on structural and functional variability in large human populations, are powerful research tools with broad applications. Knowledge-based imaging algorithms can also leverage atlased information on anatomic variation. Applications include automated image labeling, pathology detection in individuals or groups, and investigating how regional anatomy is altered in disease, and with age, gender, handedness and other clinical or genetic factors. In this report, we illustrate some of the mathematical challenges involved in constructing population-based brain atlases. A disease-specific atlas is constructed to represent the human brain in Alzheimer's disease (AD). Specialized strategies are developed for population-based averaging of anatomy. Sets of high-dimensional elastic mappings, based on the principles of continuum mechanics, reconfigure the anatomy of a large number of subjects in an anatomic image database. These mappings generate a local encoding of anatomic variability and are used to create a crisp anatomical image template with highly resolved structures in their mean spatial location. Specialized approaches are also developed to average cortical topography. Since cortical patterns are altered in a variety of diseases, gyral pattern matching is used to encode the magnitude and principal directions of local cortical variation. In the resulting cortical templates, subtle features emerge. Regional asymmetries appear that are not apparent in individual anatomies. Population-based maps of cortical variation reveal a mosaic of variability patterns that segregate sharply according to functional specialization and cytoarchitectonic boundaries.


Figures

Figure 1
Figure 1
Maps of the human cerebral cortex: flat, spherical, and tensor. Extreme differences in cortical patterns (3D models, top left) present challenges in brain mapping, because of the need to compare and integrate cortically derived brain maps from many subjects. Cortical geometry is compared by warping one subject's cortex onto another (top right). These warps can also transfer functional maps from one subject to another, or onto a common anatomic template for comparison. Matching cortical surfaces requires more than the matching of overall cortical geometry. Connected systems of curved sulcal landmarks, distributed over the cortical surface, must also be driven into correspondence with their counterparts in each target brain. Current approaches for deforming one cortex into the shape of another, typically simplify the problem by first representing cortical features on a 2D plane, sphere, or ellipsoid, where the matching procedure (i.e., finding u(r 2 ), above) is performed. Here, active surface extraction of the cortex provides a continuous inverse mapping from the cortex of each subject to the spherical template used to extract it. Application of these inverse maps to connected networks of curved sulci in each subject transforms the problem into one of computing an angular flow vector field u(r 2 ), in spherical coordinates that drives the network elements into register on the sphere (middle panel). The full mapping (top right) can be recovered in 3D space as a displacement vector field that drives cortical regions in one brain into precise registration with their counterparts in the other brain. Tensor maps (middle and lower left): Although these simple two‐parameter surfaces can serve as proxies for the cortex, different amounts of local dilation and contraction (encoded in the metric tensor if the mapping, gjk (r)) are required to transform the cortex into a simpler two‐parameter surface. These variations complicate the direct application of 2D regularization equations for matching their features. A covariant tensor approach (red box) addresses this difficulty. The regularization operator L is replaced by its covariant form L , in which correction terms (Christoffel symbols, Γ ijk) compensate for fluctuations in the metric tensor of the flattening procedure. This allows either flat or spherical maps to support cross‐subject comparisons and registrations of cortical data by eliminating the confounding effects of metric distortions that necessarily occur in the flattening procedure.
Figure 2
Figure 2
Gyral pattern matching. (a)Flat cortical map for the left hemisphere of one subject, with the average cortical pattern for the group overlaid (colored lines). (b) Result of warping the individual's sulcal pattern into the average configuration for the group, using the covariant field equations (Appendix). The individual cortex (a) is reconfigured (b) to match the average set of cortical curves. The 3D cortical regions that map to these average locations are then recovered in each individual subject, as follows. A color code (c) representing 3D cortical point locations (e) in this subject is convected along with the flow that drives the sulcal pattern into the average configuration for the group (d). Once this is done in all the subjects, points on each individual's cortex are recovered (f) that have the same relative location to the primary folding pattern in all subjects. Averaging of these corresponding points results in a crisp average cortex (see Fig. 3). Three‐dimensional variability patterns across the cortex are also measured by driving individual cortical patterns into local correspondence with the average cortical model. Panel (g) shows how one subject's anatomy (brown surface mesh) deviates from the average cortex (white), after affine alignment of the individual data. In (h), the deformation vector field required to reconfigure the gyral pattern of the subject into the exact configuration of the average cortex. The transformation is shown as a flow field that takes the individual's anatomy onto the right hemisphere of the average cortex (blue surface mesh). The greatest deformation is required in temporal and parietal cortex (pink colors, large deformation). Details of the 3D vector deformation field (h, inset) show the local complexity of the mapping. Storage of these mappings allows quantification of local anatomic variability. (i) Continuum‐mechanical mapping of a patient into the group average configuration. Instead of matching just the cortex, this figure shows the complex transformation required to match 84 surface models in a given patient, after affine alignment, into the configuration of an average surface set derived for the group. The effects of several anatomic surfaces driving the transformation are indicated, including the cingulate sulcus (CING), hippocampal surface (HPCP), superior ventricular horn (VTS), parieto‐occipital sulcus, and the anterior calcarine fissure (CALCa). This surface‐based vector field is extended to a full volumetric transformation field (0.1 billion degrees of freedom) [Thompson and Toga, 1996], which reconfigures the patient's anatomy into correspondence with the average configuration for the group. These transformation fields are stored and used to measure regional variability.
Figure 3
Figure 3
Average brain templates and 3D cortical variability. Axial, sagittal, and coronal images are shown from a variety of population‐based brain image templates. For comparison purposes, (a) shows a widely used average intensity dataset (ICBM305) based on 305 young normal subjects, created by the International Consortium for Brain Mapping [Evans et al., 1994]; by contrast,(b) and (c) are average brain templates created from high‐resolution 3D MRI scans of Alzheimer's disease patients. (b) Affine brain template, constructed by averaging normalized MR intensities on a voxel‐by‐voxel basis data after automated affine registration. (c) Continuum‐mechanical brain template, based on intensity averaging after continuum‐mechanical transformation. By using spatial transformations of increasing complexity, each patient's anatomy can increasingly be reconfigured into the average anatomical configuration for the group. After intensity correction and normalization, the reconfigured scans are then averaged on a pixel‐by‐pixel basis to produce a group image template with the average geometry and average image intensity for the group. Anatomical features are highly resolved, even at the cortex (c). Transformations of extremely high spatial dimension are required to match cortical features with sufficient accuracy to resolve them after scans are averaged together. (d) The profile of variability across the cortex is shown (N = 26 subjects), after differences in brain orientation and size are removed by transforming individual data into Talairach stereotaxic space. The following views are shown: oblique frontal, frontal, right, left, top, bottom. Extreme variability in posterior perisylvian zones and superior frontal association cortex (12–14 mm; red colors) contrasts sharply with the comparative invariance of primary sensory, motor, and orbitofrontal cortex (2–5 mm, blue colors). Models are orthographically projected onto the Talairach stereotaxic grid to facilitate comparisons with activation data from functional imaging studies reported in this system [Fox et al., 1994].

Similar articles

Cited by

References

    1. Ashburner J, Friston K. 1997. Multimodal image coregistration and partitioning — a unified framework. NeuroImage 6:209–217. - PubMed
    1. Ashburner J, Hutton C, Frackowiak R, Johnsrude I, Price C, Friston K. 1998. Identifying global anatomical differences: deformation‐based morphometry. Hum Brain Mapp 6: 348–357. - PMC - PubMed
    1. Bookstein FL. 1997. Landmark methods for forms without landmarks: morphometrics of group differences in outline shape. Med Image Analysis 1: 225–243. - PubMed
    1. Cao J, Worsley KJ. 1999. The geometry of the Hotelling's T‐squared random field with applications to the detection of shape changes. Annals of Statistics (in press).
    1. Christensen GE, Rabbitt RD, Miller MI. 1993. A deformable neuroanatomy textbook based on viscous fluid mechanics. 27th Ann. Conf. on Inf. Sciences and Systems, p 211–216.

Publication types

LinkOut - more resources