

Pharmacokinetics and pharmacodynamics of lumefantrine (benflumetol) in acute falciparum malaria
- PMID: 10681341
- PMCID: PMC89749
- DOI: 10.1128/AAC.44.3.697-704.2000
Pharmacokinetics and pharmacodynamics of lumefantrine (benflumetol) in acute falciparum malaria
Abstract
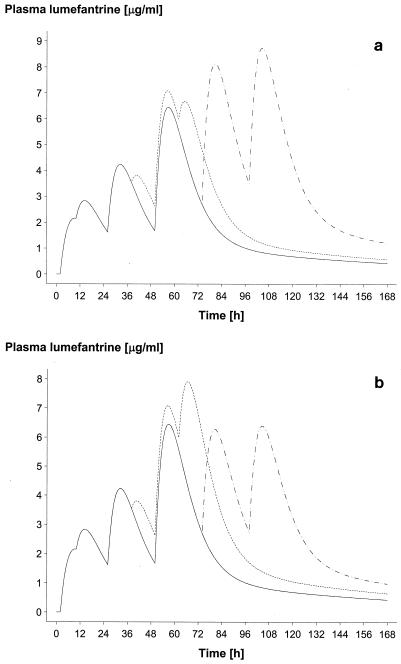
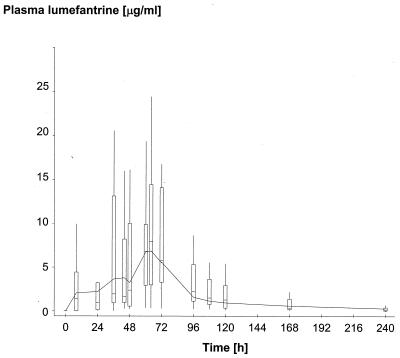
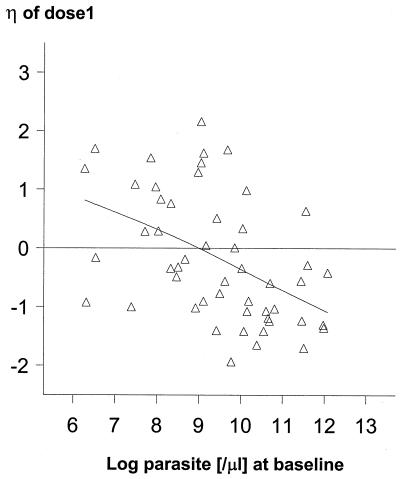
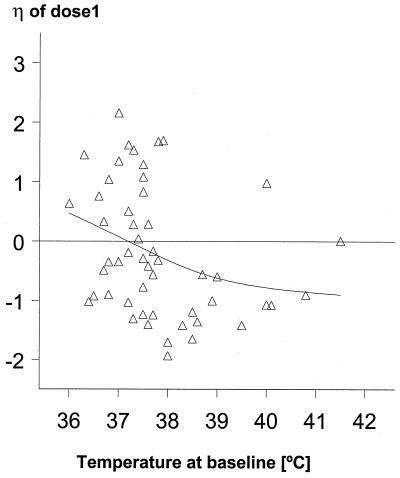
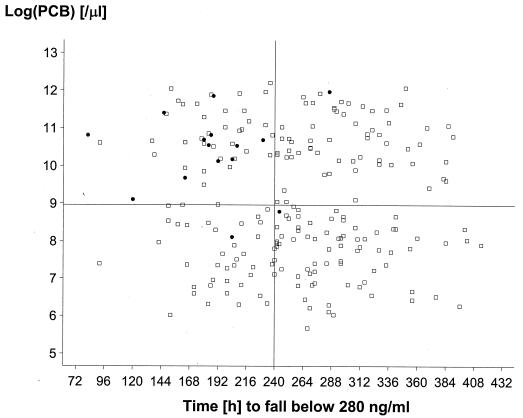
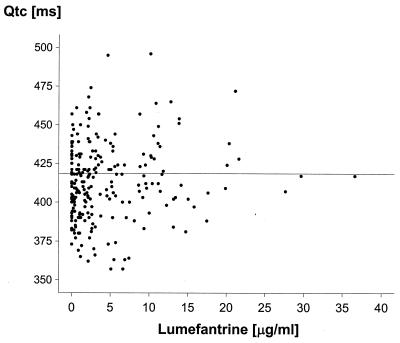
The objective of this study was to conduct a prospective population pharmacokinetic and pharmacodynamic evaluation of lumefantrine during blinded comparisons of artemether-lumefantrine treatment regimens in uncomplicated multidrug-resistant falciparum malaria. Three combination regimens containing an average adult lumefantrine dose of 1,920 mg over 3 days (four doses) (regimen A) or 2,780 mg over 3 or 5 days (six doses) (regimen B or C, respectively) were given to 266 Thai patients. Detailed observations were obtained for 51 hospitalized adults, and sparse data were collected for 215 patients of all ages in a community setting. The population absorption half-life of lumefantrine was 4.5 h. The model-based median (5th and 95th percentiles) peak plasma lumefantrine concentrations were 6.2 (0.25 and 14.8) microgram/ml after regimen A, 9. 0 (1.1 and 19.8) microgram/ml after regimen B, and 8 (1.4 and 17.4) microgram/ml after regimen C. During acute malaria, there was marked variability in the fraction of drug absorbed by patients (coefficient of variation, 150%). The fraction increased considerably and variability fell with clinical recovery, largely because food intake was resumed; taking a normal meal close to drug administration increased oral bioavailability by 108% (90% confidence interval, 64 to 164) (P, 0.0001). The higher-dose regimens (B and C) gave 60 and 100% higher areas under the concentration-time curves (AUC), respectively, and thus longer durations for which plasma lumefantrine concentrations exceeded the putative in vivo MIC of 280 microgram/ml (median for regimen B, 252 h; that for regimen C, 298 h; that for regimen A, 204 h [P, 0.0001]) and higher cure rates. Lumefantrine oral bioavailability is very dependent on food and is consequently poor in acute malaria but improves markedly with recovery. The high cure rates with the two six-dose regimens resulted from increased AUC and increased time at which lumefantrine concentrations were above the in vivo MIC.
Figures

References
-
- Brockman A, Paul R E L, Anderson T J C, Hackford I, Phaiphun L, Nosten F, Day K P. Application of genetic markers to the identification of recrudescent Plasmodium falciparum infections on the northwestern border of Thailand. Am J Trop Med Hyg. 1999;60:14–21. - PubMed
-
- Davidian M, Giltinan A R. Nonlinear models for repeated measurements data. London, England: Chapman & Hall, Ltd.; 1995.
-
- Gibaldi M, Perrier D. Pharmacokinetics. 2nd ed. New York, N.Y: Marcel Dekker, Inc.; 1982.
-
- Hussein Z, Eaves J, Hutchinson D B, Canfield C J. Population pharmacokinetics of atovaquone in patients with acute malaria caused by Plasmodium falciparum. Clin Pharmacol Ther. 1997;61:518–530. - PubMed
Publication types
MeSH terms
Substances
Grants and funding
LinkOut - more resources
Full Text Sources
