. 2000 Feb 29;97(5):2214-9.
doi: 10.1073/pnas.040548097.

Transferrin receptor 2: continued expression in mouse liver in the face of iron overload and in hereditary hemochromatosis

Affiliations

Transferrin receptor 2: continued expression in mouse liver in the face of iron overload and in hereditary hemochromatosis

R E Fleming et al. Proc Natl Acad Sci U S A. .

Abstract

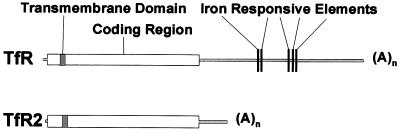
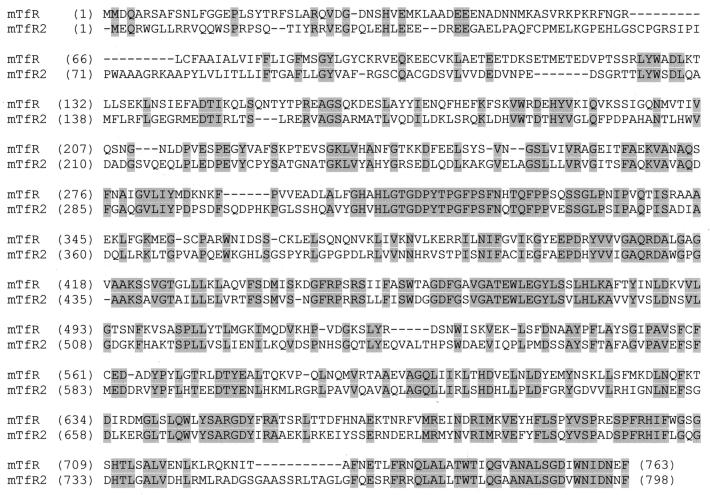
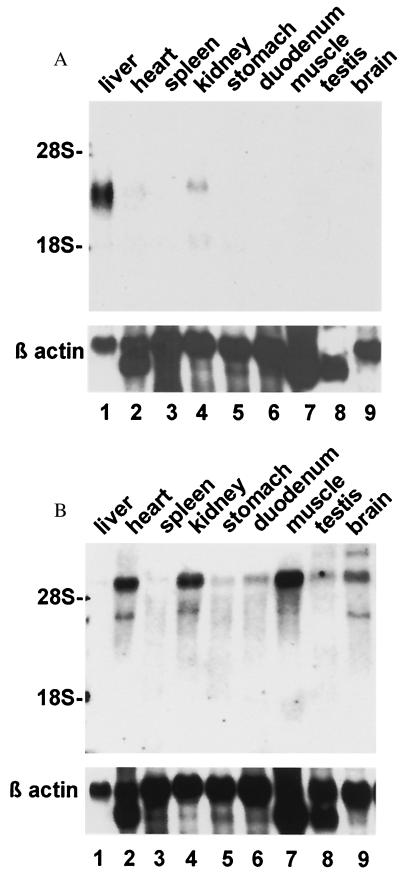
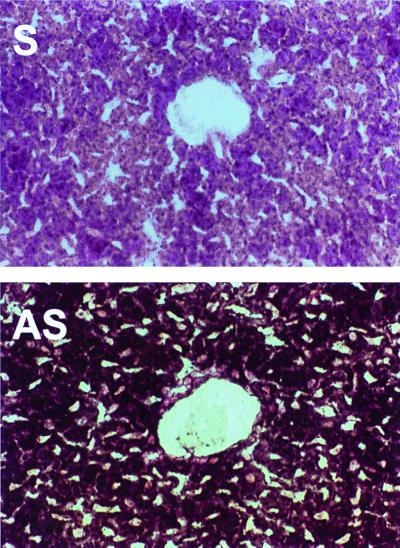
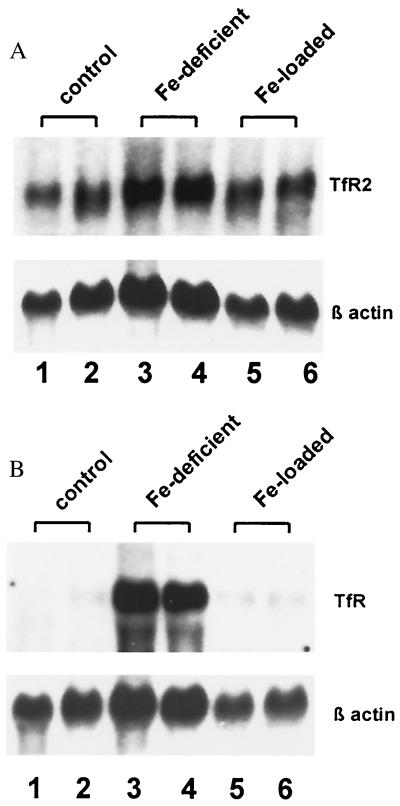
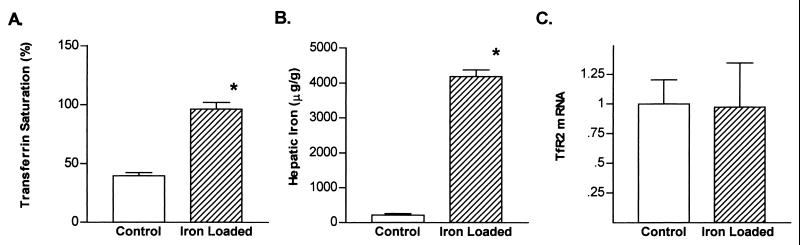
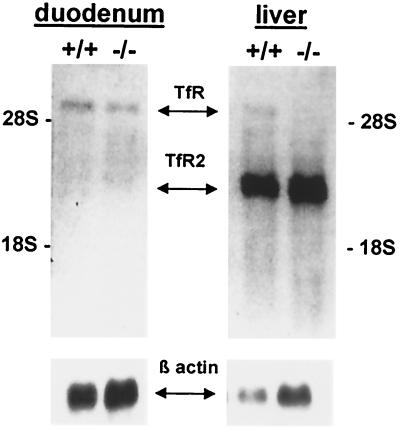
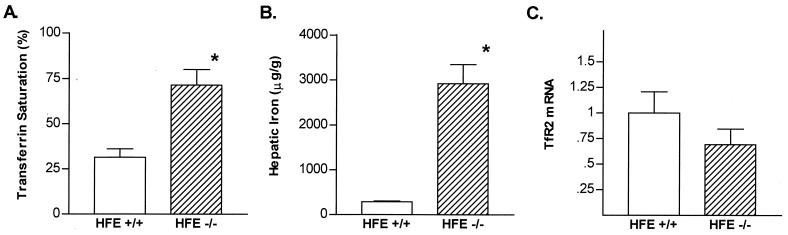
Hereditary hemochromatosis (HH) is a common autosomal recessive disorder characterized by excess absorption of dietary iron and progressive iron deposition in several tissues, particularly liver. Liver disease resulting from iron toxicity is the major cause of death in HH. Hepatic iron loading in HH is progressive despite down-regulation of the classical transferrin receptor (TfR). Recently a human cDNA highly homologous to TfR was identified and reported to encode a protein (TfR2) that binds holotransferrin and mediates uptake of transferrin-bound iron. We independently identified a full-length murine EST encoding the mouse orthologue of the human TfR2. Although homologous to murine TfR in the coding region, the TfR2 transcript does not contain the iron-responsive elements found in the 3' untranslated sequence of TfR mRNA. To determine the potential role for TfR2 in iron uptake by liver, we investigated TfR and TfR2 expression in normal mice and murine models of dietary iron overload (2% carbonyl iron), dietary iron deficiency (gastric parietal cell ablation), and HH (HFE -/-). Northern blot analyses demonstrated distinct tissue-specific patterns of expression for TfR and TfR2, with TfR2 expressed highly only in liver where TfR expression is low. In situ hybridization demonstrated abundant TfR2 expression in hepatocytes. In contrast to TfR, TfR2 expression in liver was not increased in iron deficiency. Furthermore, hepatic expression of TfR2 was not down-regulated with dietary iron loading or in the HFE -/- model of HH. From these observations, we propose that TfR2 allows continued uptake of Tf-bound iron by hepatocytes even after TfR has been down-regulated by iron overload, and this uptake contributes to the susceptibility of liver to iron loading in HH.


Figures

Figure 1
Figure 1
Comparison of TfR and TfR2 transcripts. The relative sizes and composition of the TfR and TfR2 transcripts are represented. The TfR transcript is 4.9 kb and the TfR2 2.8 kb, with the size difference accountable to a shorter 3′ untranslated region in TfR2 that excludes the region containing the iron-responsive elements.
Figure 2
Figure 2
Comparison of deduced amino acid sequences of mouse TfR2 and TfR. The deduced amino acid sequence of murine TfR2 is compared with that of the classical murine TfR. Strictly conserved amino acids are shaded.
Figure 3
Figure 3
Northern blot analysis of the tissue-specific expression of TfR2 and TfR. Fifteen micrograms of total cellular RNA from the murine tissues indicated (Top) was electrophoresed in duplicate and blotted. Blots were hybridized with 32P-labeled probe for mouse TfR2 (A) or mouse TfR (B). The blots were washed under high stringency and exposed to film for 18 hr with an intensifying screen, then rehybridized with a probe for β-actin (Bottom). Positions of the 28S and 18S ribosomal RNA bands are indicated (Left).
Figure 4
Figure 4
In situ hybridization analysis of TfR2 mRNA expression in liver. Frozen sections of mouse liver were hybridized with sense (S) or antisense (AS) digoxigenin-labeled probes transcribed from the TfR2 cDNA. Signal was detected as alkaline phosphatase activity by using NBT as a substrate and appears as a dark blue product. The sections were counterstained with nuclear fast red and analyzed by light microscopy (×400).
Figure 5
Figure 5
Northern blot analysis of TfR2 and TfR expression in mice with dietary iron deficiency or overload. Liver RNA was isolated from mice maintained on a standard (0.02% iron) diet (lanes 1 and 2), mice with dietary iron deficiency (lanes 3 and 4), and mice maintained on a diet supplemented with 2% carbonyl iron for 6 wk (lanes 5 and 6). Fifteen micrograms of total cellular RNA was electrophoresed in duplicate and blotted. Blots were hybridized with 32P-labeled probes for mouse TfR2 (A) or mouse TfR (B). Blots were washed under high stringency, exposed to film for 18 hr with an intensifying screen, and rehybridized with a probe for β-actin (Bottom).
Figure 6
Figure 6
Iron status and hepatic TfR2 mRNA expression in control mice and mice with dietary iron overload. Serum transferrin saturations (A), hepatic iron concentrations (B), and relative TfR2 liver mRNA contents (C) were compared in mice maintained on a standard diet (open bars) and mice maintained on a diet supplemented with 2% carbonyl iron for 6 wk (shaded bars). TfR2 mRNA levels were normalized to those for β-actin and are expressed relative to the mean of the control group. Values are expressed as mean +/− SEM, n = 5, each group. *, P < 0.05 by Student's t test, with Welch's correction for unequal variance.
Figure 7
Figure 7
Northern blot analysis of duodenal and hepatic TfR and TfR2 expression in control and HFE knockout mice. Duodenal and liver RNA was isolated from HFE knockout mice (−/−) and wild-type littermates (+/+) maintained on a standard diet. Fifteen micrograms of total cellular RNA was electrophoresed in duplicate and blotted. The blot was hybridized with a 32P-labeled probe for mouse TfR2 and rehybridized without removing the TfR2 signal with a 32P-labeled probe for TfR. The blot was exposed to film for 18 hr with an intensifying screen. The results after the second hybridization are presented and relative positions of the TfR and TfR2 signals indicated. The blot was subsequently hybridized with a probe for β-actin (Bottom).
Figure 8
Figure 8
Iron status and hepatic TfR2 mRNA expression in control and HFE knockout mice. Serum transferrin saturations (A), hepatic iron concentrations (B), and relative TfR2 liver mRNA contents (C) are compared in control mice (HFE +/+, open bars) and HFE knockout mice (−/−, shaded bars) maintained on a standard diet. TfR2 mRNA levels were normalized to those for β-actin and are expressed relative to the mean of the control (+/+) group. TfR mRNA levels were not significantly different between HFE −/− and control mice. Values are expressed as mean +/− SEM (n = 5, each group). *, P < 0.05 by Student's t test, with Welch's correction for unequal variance.

Similar articles

Cited by

References

    1. Bacon B R, Powell L W, Adams P C, Kresina T F, Hoofnagle J H. Gastroenterology. 1999;116:193–207. - PubMed
    1. Niederau C, Erhardt A, Häussinger D, Strohmeyer G. J Hepatol. 1999;30:6–11. - PubMed
    1. Bonkovsky H L. Am J Med Sci. 1991;301:32–43. - PubMed
    1. Hubert N, Lescoat G, Sciot R, Moirand R, Jego P, Leroyer P, Brissot P. J Hepatol. 1993;18:301–312. - PubMed
    1. Testa U, Pelosi E, Peschle C. Crit Rev Oncog. 1993;4:241–276. - PubMed

Publication types

Associated data