. 2000 Feb;129(4):709-23.
doi: 10.1038/sj.bjp.0703096.

M-type K+ currents in rat cultured thoracolumbar sympathetic neurones and their role in uracil nucleotide-evoked noradrenaline release

Affiliations

M-type K+ currents in rat cultured thoracolumbar sympathetic neurones and their role in uracil nucleotide-evoked noradrenaline release

W Nörenberg et al. Br J Pharmacol. 2000 Feb.

Abstract

Cultured sympathetic neurones are depolarized and release noradrenaline in response to extracellular ATP, UDP and UTP. We examined the possibility that, in neurones cultured from rat thoracolumbar sympathetic ganglia, inhibition of the M-type potassium current might underlie the effects of UDP and UTP. Reverse transcriptase-polymerase chain reaction indicated that the cultured cells contained mRNA for P2Y(2)-, P2Y(4)- and P2Y(6)-receptors as well as for the KCNQ2- and KCNQ3-subunits which have been suggested to assemble into M-channels. In cultures of neurones taken from newborn as well as from 10 day-old rats, oxotremorine, the M-channel blocker Ba(2+) and UDP all released previously stored [(3)H]-noradrenaline. The neurones possessed M-currents, the kinetic properties of which were similar in neurones from newborn and 9 - 12 day-old rats. UDP, UTP and ATP had no effect on M-currents in neurones prepared from newborn rats. Oxotremorine and Ba(2+) substantially inhibited the current. ATP also had no effect on the M-current in neurones prepared from 9 - 12 day-old rats. Oxotremorine and Ba(2+) again caused marked inhibition. In contrast to cultures from newborn animals, UDP and UTP attenuated the M-current in neurones from 9 - 12 day-old rats; however, the maximal inhibition was less than 30%. The results indicate that inhibition of the M-current is not involved in uracil nucleotide-induced transmitter release from rat cultured sympathetic neurones during early development. M-current inhibition may contribute to release at later stages, but only to a minor extent. The mechanism leading to noradrenaline release by UDP and UTP remains unknown.


Figures
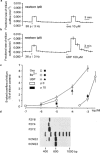
Figure 1
Figure 1
Tritium outflow from rat sympathetic neurones preincubated with [3H]-noradrenaline (a–c) and presence of mRNA for P2Y subtypes and KCNQ subunits (d). Effects of electrical stimulation (a,b), oxotremorine (a,c), Ba2+ (c) and UDP (b,c) on tritium outflow: After preincubation with [3H]-noradrenaline cells were superfused with [3H]-noradrenaline-free buffer containing desipramine (1 μM). At t=66 min of superfusion they were stimulated by 36 pulses (p) at 3 Hz. At t=90 min they were stimulated by oxotremorine, Ba2+ or UDP for 1 min. (a) and (b) show efflux-versus-time curves. Tritium outflow is expressed as fractional rate (min−1). (c) shows concentration-response curves for oxotremorine, Ba2+ and UDP in cultures from newborn (p0) rats (empty symbols). Also shown are responses to oxotremorine (10 μM), Ba2+ (1000 μM) and UDP (100 μM) in cultures from 10 day-old (p10) rats (filled symbols). Means±s.e.mean of 6–12 superfusion chambers from 2–6 different preparations. *Significant difference from oxotremorine (10 μM) at p0 (P<0.05). (d) RT–PCR was performed using purified poly A+ mRNA from p0 cultures and gene-specific primers for P2Y2, P2Y4, P2Y6, KCNQ2 and KCNQ3. The PCR products were visualized by staining with ethidium bromide after agarose gel electrophoresis. The size of the products was compared to a standard (bp, base pairs). The figure shows one representative result from four independent mRNA preparations.
Figure 2
Figure 2
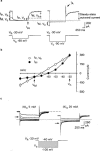
M-currents in TLG neurones from p0 rats measured in the amphotericin B-perforated patch configuration. (a) Current responses (upper panel) to 1.5-s hyperpolarizing voltage-steps (lower panel) from a holding potential (Vh) of −30 mV to command potentials (Vc) of −60 (left) and −90 mV (right). Note the slow deactivation (IM, Vc) and slow reactivation (IM, Vh) of the M-current, subsequent to instantaneous currents at the start (Iin, Vh) and the end (Iin, Vc) of the voltage-step to −60 mV. The steady outward current with respect to the zero current level (dotted line in this and all subsequent figures) at the Vh of −30 mV is due do tonic activation of the M-current. The transient outward current at the end of the voltage-step to −90 mV presumably is due to activation of the A-type K+ current (IA). (b) Current-voltage curves (n=12) for instantaneous (Iin, Vh) and steady-state currents (Iss) measured as indicated in (a) for voltage-steps from the Vh of −30 mV to command potentials between −40 and −100 mV. Arrows indicate holding potential (Vh) and M-current reversal potential (VM). (c) Families of current responses (upper panel) to 1.5-s hyperpolarizing voltage-steps imposed with 10 mV increments to between −40 and −100 mV (lower panel) in 5 mM (standard) and 25 mM external K+ in the same cell. The broken line indicates the steady outward current level in 5 mM K+. Note that IM, Vc for a voltage-step to −60 mV (arrows) is inward (downward deflection) in 5 mM K+ but outward (upward deflection) in 25 mM K+, indicating the dependence of the M-current reversal potential on the K+ gradient.
Figure 3
Figure 3
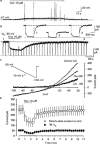
Effects of oxotremorine on membrane potential (a) and M-currents (b–d) in TLG neurones from p0 rats measured in the amphotericin B-perforated patch configuration. (a) Pressure application of oxotremorine (10 μM) for 2.5 min (horizontal bar) evokes a depolarization accompanied by action potential firing. (b) Effects of oxotremorine (10 μM), pressure-applied for 90 s (horizontal bar), on the steady outward current at a Vh of −30 mV (continuous recording, lower panel) and on M-current deactivation relaxations (upper panel). Shown are current amplitudes in response to voltage-steps to −60 mV, imposed every 20 s, 40 s before (1), after 80 s in the presence (2), and after 490 s of washout (3) of oxotremorine. (c) Current-voltage curves obtained by recording membrane current responses (ordinate) to a voltage ramp (10 mV s−1, from −30 to −100 mV; inset) imposed in the absence [A] and in the presence [B] of oxotremorine (Oxo; 10 μM), pressure-applied for 80 s to the same cell. The line [A]–[B] is the oxotremorine-sensitive current (‘current in the absence of oxotremorine' minus ‘current in the presence of oxotremorine') showing outward rectification positive to −70 mV. (d) Statistical evaluation of the effect of oxotremorine (10 μM), pressure-applied for 90 s as shown in (b). Depicted are the steady-state outward currents immediately before the respective voltage-steps and the amplitudes of M-current deactivation relaxations (IM, Vc) in response to the voltage-steps. Means±s.e.mean from n=7 experiments.
Figure 4
Figure 4
Lack of effect of UDP (a–c) and effects of oxotremorine and Ba2+ (a) on M-currents in TLG neurones from p0 rats measured in the amphotericin B-perforated patch configuration. (a) UDP (100 μM), oxotremorine (10 μM) and Ba2+ (300 μM) were consecutively pressure-applied for 90 s (horizontal bars) to the same neurone. Between single drug applications, the cell was superfused with drug-free bath solution for 10 min. Shown are effects of UDP, oxotremorine and Ba2+ on the steady-state outward current at the Vh of −30 mV (lower panels) as well as effects of UDP (1, 2, 3) and Ba2+ (4, 5, 6) on M-current deactivation relaxations (upper panels) in response to 1-s voltage-steps to −60 mV, imposed every 20 s, 40 s before (1, 4), after 80 s in the presence (2, 5), and after 490 s washout (3, 6) of UDP and Ba2+, respectively. (b) Two current-voltage curves obtained by recording membrane current responses to voltage ramps (10 mV s−1, from −30 to −100 mV) imposed in the absence (control) and in the presence of UDP (100 μM), pressure-applied for 80 s to the same cell, are superimposed. (c) Statistical evaluation of the effect of UDP (100 μM), pressure-applied for 90 s as shown in (a). Depicted are the steady-state outward currents immediately before the respective voltage-steps and the amplitudes of M-current deactivation relaxations (IM, Vc) in response to the voltage-steps. Means±s.e.mean from n=7 experiments.
Figure 5
Figure 5
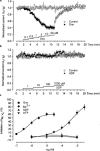
Concentration-dependence of the effects of oxotremorine (a,c), Ba2+ (c), UDP (b,c) and UTP (c) on M-currents in TLG neurones from p0 rats measured in the amphotericin B-perforated patch configuration. M-current deactivation relaxations (IM, Vc) were evoked by 1-s voltage-steps from −30 to −60 mV, one every 10 s. Oxotremorine (0.1–30 μM), Ba2+ (10–3000 μM, UDP (1–1000 μM) or UTP (1–1000 μM) was pressure-applied at increasing concentrations, each concentration for 1.5 min (oxotremorine, Ba2+) or 3 min (UDP, UTP). When normalized with respect to the first M-current deactivation amplitude in the series (It/I0), IM, Vc was stable over time in control experiments (a,b). Oxotremorine concentration-dependently depressed IM, Vc (a) whereas UDP was ineffective (b). (c) shows concentration-inhibition curves for oxotremorine, Ba2+, UDP and UTP. Drug effects are expressed as percentage inhibition of IM, Vc; IM, Vc at t=0 was taken as zero inhibition. Curves for oxotremorine and Ba2+ were fitted according to equation (1). Means±s.e.mean from n=5–8 experiments.
Figure 6
Figure 6
Effects of oxotremorine (d), Ba2+ (d), UDP (a–d) and UTP (d) on M-currents in TLG neurones from p9–p12 rats measured in the amphotericin B-perforated patch configuration. (a) UDP (100 μM) was pressure-applied for 90 s (horizontal bar). Shown are effects of UDP on the steady-state outward current at the Vh of −30 mV (lower panel) as well as on M-current deactivation relaxations (upper panel) in response to 1-s voltage-steps to −60 mV, imposed every 20 s, 40 s before (1), after 80 s in the presence (2), and after 490 s washout (3) of UDP. (b) Current-voltage curves obtained by recording membrane current responses to a voltage ramp (10 mV s−1, from −30 to −100 mV) imposed in the absence [A] and in the presence [B] of UDP (100 μM), pressure-applied for 80 s to the same cell. The line [A]–[B] is the UDP-sensitive current (‘current in the absence of UDP' minus ‘current in the presence of UDP') showing outward rectification positive to −70 mV. (c) Statistical evaluation of the effect of UDP (100 μM), pressure-applied for 90 s as shown in (a). Depicted are the steady-state outward currents immediately before the respective voltage-steps and the amplitudes of M-current deactivation relaxations (IM, Vc) in response to the voltage-steps. Means±s.e.mean from n=6 experiments. (d) shows concentration-inhibition curves for oxotremorine, Ba2+, UDP and UTP. Curves were determined as shown for p0 rats in Figure 5 and were fitted according to equation (1). Means±s.e.mean from n=6–8 experiments.
Figure 7
Figure 7
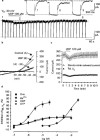
Lack of effect of ATP on M-currents in TLG neurones from p0 rats measured in the amphotericin B-perforated patch configuration. (a) ATP (100 μM) was pressure-applied for 90 s (horizontal bars) at a holding potential of −30 mV and subsequently at a holding potential of −70 mV to the same neurone. Shown are effects of ATP on the steady-state outward current at the Vh of −30 mV (middle panel), on M-current deactivation relaxations in response to 1-s voltage-steps to −60 mV, imposed every 20 s, 40 s before (1), after 40 s in the presence (2), and after 490 s of washout (3) of ATP (upper panel), and on the steady-state holding current at the Vh of −70 mV (lower panel). (b) Current-voltage curves obtained by recording membrane current responses to a voltage-ramp (10 mV s−1, from −30 to −100 mV) imposed in the absence [A] and in the presence [B] of ATP (100 μM), pressure-applied for 60 s to the same cell. The line [B]–[A] is the ATP-induced current (‘current in the presence of ATP' minus ‘current in the absence of ATP') showing inward rectification over the whole voltage-range tested. (c) Statistical evaluation of the effect of ATP (100 μM), pressure-applied for 90 s as shown in (a), holding potential −30 mV. Depicted are the steady-state outward currents immediately before the respective voltage-steps and the amplitudes of M-current deactivation relaxations in response to the voltage-steps (IM, Vc). Means±s.e.mean from n=5 experiments.

Similar articles

Cited by

References

    1. ADAMS D.J., HARPER A.A.Electrophysiological properties of autonomic ganglion neurons Autonomic ganglia 19956Harwood Academic Publishers: Luxembourg; 153–212.In: Mc Lachlan, E.M.(ed.) Autonomic Nervous System Series
    1. ADAMS P.R., BROWN D.A. Actions of γ-aminobutyric acid on sympathetic ganglion cells. J. Physiol. (London) 1975;250:85–120. - PMC - PubMed
    1. ADAMS P.R., BROWN D.A., CONSTANTI A. Pharmacological inhibition of the M-current. J. Physiol. (London) 1982a;332:223–262. - PMC - PubMed
    1. ADAMS P.R., BROWN D.A., CONSTANTI A. M-currents and other potassium currents in bullfrog sympathetic neurones. J. Physiol. (London) 1982b;330:537–562. - PMC - PubMed
    1. BALLANYI K., GRAFE P. An intracellular analysis of γ-aminobutyric-acid associated ion movements in rat sympathetic neurones. J. Physiol. (London) 1985;365:41–58. - PMC - PubMed

Publication types

MeSH terms

LinkOut - more resources