. 2000 Feb 21;148(4):715-26.
doi: 10.1083/jcb.148.4.715.

Intracellular distribution of mammalian protein kinase A catalytic subunit altered by conserved Asn2 deamidation

Affiliations

Intracellular distribution of mammalian protein kinase A catalytic subunit altered by conserved Asn2 deamidation

R Pepperkok et al. J Cell Biol. .

Abstract

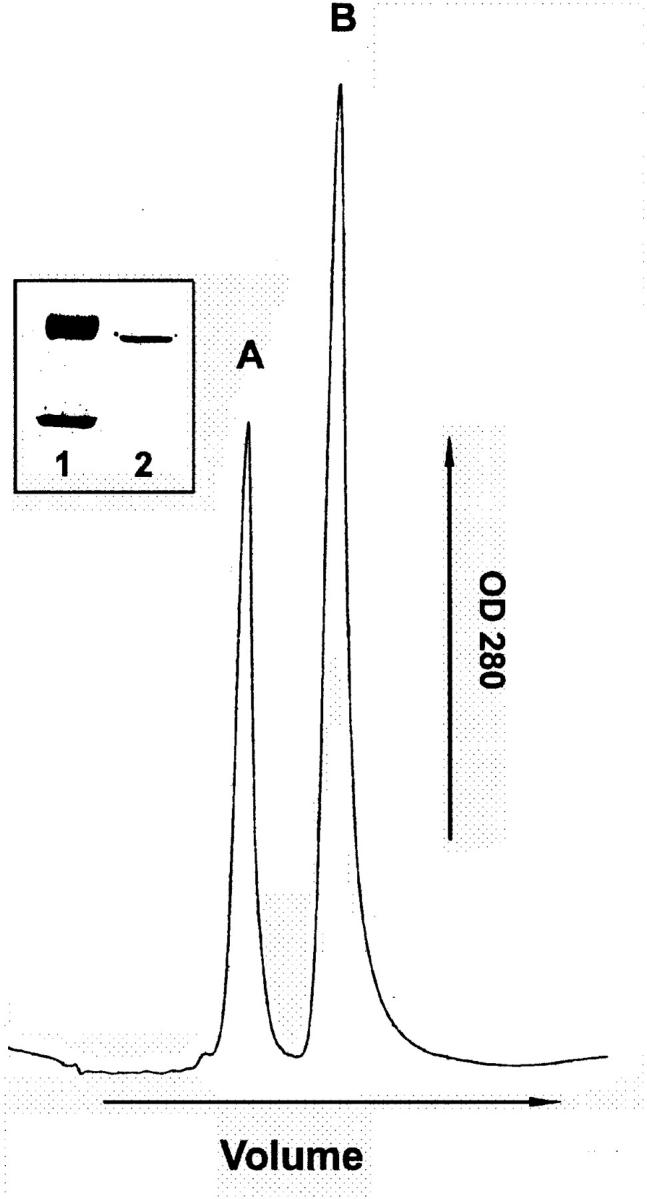
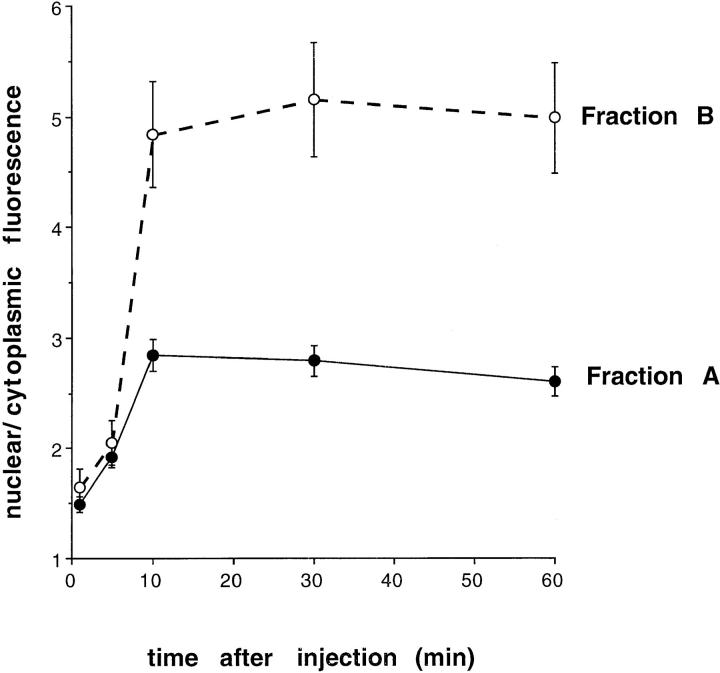
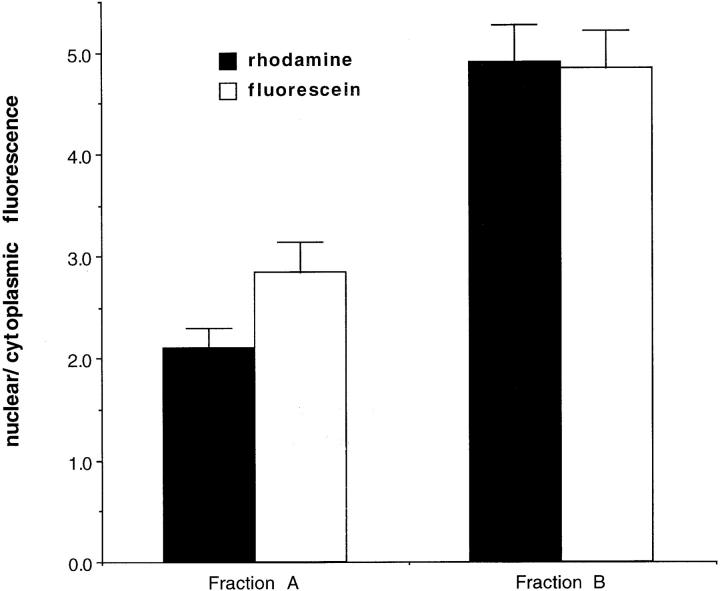
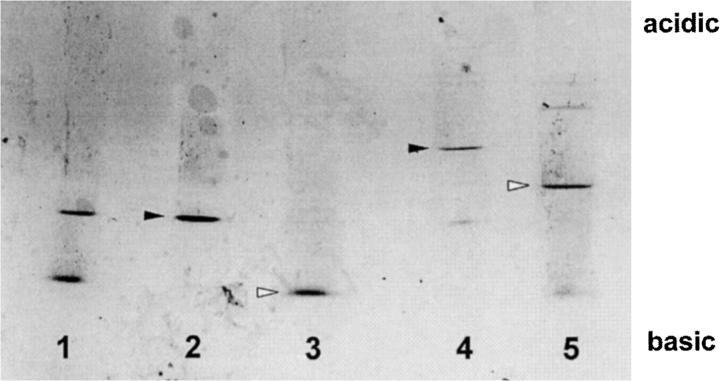
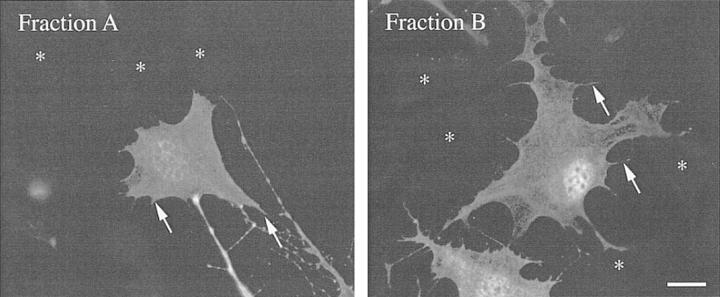
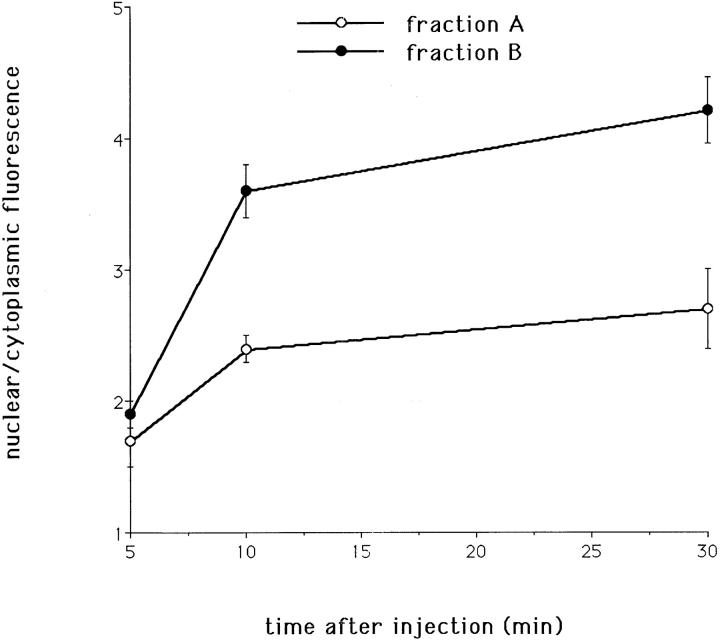
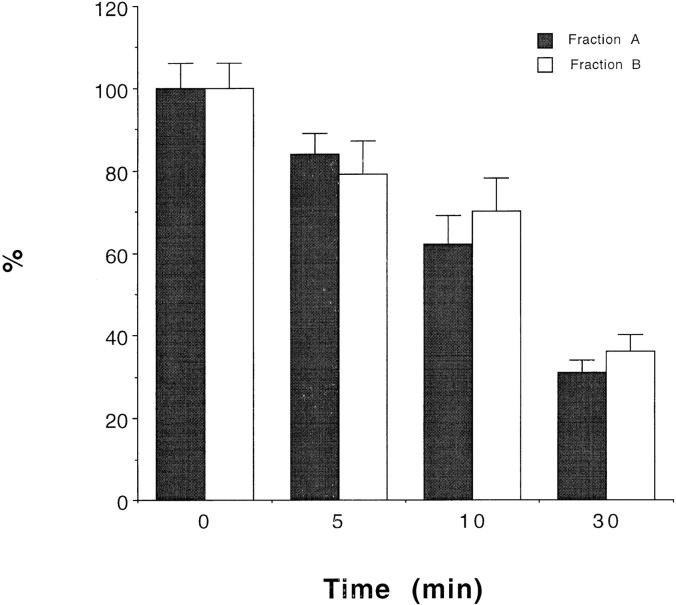
The catalytic (C) subunit of protein kinase A functions both in the cytoplasm and the nucleus. A major charge variant representing about one third of the enzyme in striated muscle results from deamidation in vivo of the Asn2 residue at the conserved NH(2)-terminal sequence myrGly-Asn-Ala (Jedrzejewski, P.T., A. Girod, A. Tholey, N. König, S. Thullner, V. Kinzel, and D. Bossemeyer. 1998. Protein Sci. 7:457-469). Because of the increase of electronegativity by generation of Asp2, it is reminiscent of a myristoyl-electrostatic switch. To compare the intracellular distribution of the enzymes, both forms of porcine or bovine heart enzyme were microinjected into the cytoplasm of mouse NIH 3T3 cells after conjugation with fluorescein, rhodamine, or in unlabeled form. The nuclear/cytoplasmic fluorescence ratio (N/C) was analyzed in the presence of cAMP (in the case of unlabeled enzyme by antibodies). Under all circumstances, the N/C ratio obtained with the encoded Asn2 form was significantly higher than that with the deamidated, Asp2 form; i.e., the Asn2 form reached a larger nuclear concentration than the Asp2 form. Comparable data were obtained with a human cell line. The differential intracellular distribution of both enzyme forms is also reflected by functional data. It correlates with the degree of phosphorylation of the key serine in CREB family transcription factors in the nucleus. Microinjection of myristoylated recombinant bovine Calpha and the Asn2 deletion mutant of it yielded N/C ratios in the same range as encoded native enzymes. Thus, Asn2 seems to serve as a potential site for modulating electronegativity. The data indicate that the NH(2)-terminal domain of the PKA C-subunit contributes to the intracellular distribution of free enzyme, which can be altered by site-specific in vivo deamidation. The model character for other signaling proteins starting with myrGly-Asn is discussed.


Figures

Figure 1
Figure 1
Separation of electrophoretically homogenous PKA C-subunit (porcine heart) on cation exchange resin into fractions A and B. (inset) Enzyme in SDS gel stained with Coomassie blue: (lane 2) molecular mass standard proteins ovalbumin 43 kD, and carboanhydrase 30 kD (lane 1).
Figure 2
Figure 2
Cellular distribution of microinjected PKA C-subunit fractions A and B labeled with fluorescein. NIH 3T3 cells were microinjected at room temperature with fluorescein-conjugated C-subunit fraction A or B, both at 1 mg/ml. Immediately after injection, cells were transferred to prewarmed medium containing 1 mM 8-bromo-cAMP and incubated for the time indicated at 37°C. Thereafter, cells were fixed with paraformaldehyde, and the ratio of nuclear/cytoplasmic fluorescence was determined as described in Materials and Methods. The averages and SDs of at least two experiments with >50 cells quantified per time point each are shown.
Figure 3
Figure 3
Comparison of the cellular distribution of microinjected PKA C-subunit fractions A and B conjugated with rhodamine or fluorescein. NIH 3T3 cells were microinjected at room temperature with labeled C-subunit fractions adjusted to 1 mg/ml. After a 10-min postinjection incubation at 37°C in the presence of 1 mM 8-bromo-cAMP, cells were fixed and the nuclear to cytoplasmic fluorescence was determined as described in Materials and Methods. The averages and SDs of two experiments with at least 60 cells quantified per group are shown.
Figure 4
Figure 4
Isoelectric focusing results obtained with native porcine PKA C-subunit, before (lane 1) and after separation in fraction A (lane 2) and fraction B (lane 3). Fluorescein-labeled fractions A and B are shown in lane 4 and 5 respectively. Arrows indicate the native and the predominantly labeled fraction A (▸) and B (▹).
Figure 5
Figure 5
Localization of microinjected PKA C-subunit fraction A and B by immunofluorescence. Purified porcine C-subunit fractions A and B (4 mg/ml each) were injected with 5 mM cAMP (in the pipette) into the cytoplasm of NIH 3T3 cells. After injection, cells were incubated at 37°C for different periods (30 min shown here) before they were fixed and stained for C-subunit using a polyclonal rabbit antibody and corresponding rhodamine-conjugated secondary antibodies (see Materials and Methods). The anti-PKA antibody was diluted sufficiently that only microinjected cells showed a significant fluorescent staining specific for microinjected C-subunit. Asterisks indicate the nucleus of neighboring noninjected cells. The image contrast was adjusted to better visualize growth cones in injected cells (marked by arrows). Therefore, the nucleus in the cell injected with fraction B appears to be saturated. As in the other experiments, for the quantification of N/C values, the original images were used where the gray values in all the images were always below the saturation level. The mean N/C ratio ± SD determined in this experiment from >100 cells was 1.9 ± 0.2 for fraction A and 3.3 ± 0.5 for fraction B at 30 min. Bar, 20 μm.
Figure 6
Figure 6
Cellular distribution of PKA C-subunit fractions A and B detected by immunofluorescence. Cells were treated and injected as described in the legend of Fig. 5. The ratio of nuclear to cytoplasmic fluorescence was determined as described in Materials and Methods. The averages and SDs of six different experiments with at least 40 cells quantified for each value are shown.
Figure 7
Figure 7
Decay of microinjected PKA C-subunit fraction A and B. NIH 3T3 cells were microinjected with purified PKA C-subunit fraction A or B at 4 mg/ml. At different time points after injection, cells were fixed and stained by immunofluorescence for injected PKA and subsequently mounted on glass slides. Images of injected cells were acquired as described in Materials and Methods. The average PKA-specific fluorescence intensity (including the nucleus and cytoplasm) in injected cells was determined, and the value obtained for cells fixed immediately after injection (t = 0) was set at 100%. The averages and SDs of two independent experiments with at least 65 cells measured are shown. Degradation of the injected PKA proteins appeared to be similar for the fraction A and B.

References

    1. Adams S.R., Harootunian A.T., Büchler Y.J., Taylor S.S., Tsien R.Y. Fluorescence ratio imaging of cyclic AMP in single cells. Nature. 1991;349:694–697. - PubMed
    1. Ansorge W., Pepperkok R. Performance of an automated system for capillary microinjection into living cells. J. Biochem. Biophys. Methods. 1988;16:283–292. - PubMed
    1. Artigues A., Birkett A., Schirch V. Evidence for the in vivo deamidation and isomerization of an asparaginyl residue in cytosolic serine hydroxymethyltransferase. J. Biol. Chem. 1990;265:4853–4858. - PubMed
    1. Aswad D.W. Stoichiometric methylation of porcine adrenocorticotropin by protein carboxyl methyltransferase requires deamidation of asparagine 25. Evidence for methylation at the α-carboxyl group of atypical l-isoaspartyl residues. J. Biol. Chem. 1984;259:10714–10721. - PubMed
    1. Aswad D.W., Johnson B.A. The unusual substrate specificity of eukaryotic protein carboxyl methyltransferase. Trends Biochem. Sci. 1987;12:155–158.

Publication types

MeSH terms