. 2000 Mar;74(6):2826-39.
doi: 10.1128/jvi.74.6.2826-2839.2000.

Identification of a boundary domain adjacent to the potent human cytomegalovirus enhancer that represses transcription of the divergent UL127 promoter

Affiliations

Identification of a boundary domain adjacent to the potent human cytomegalovirus enhancer that represses transcription of the divergent UL127 promoter

A Angulo et al. J Virol. 2000 Mar.

Abstract

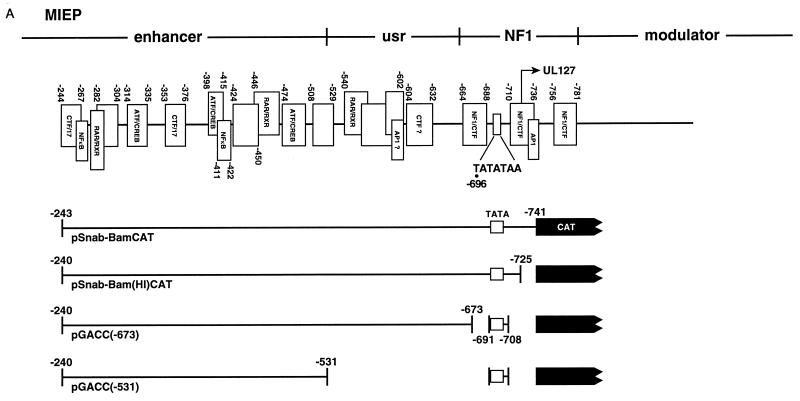
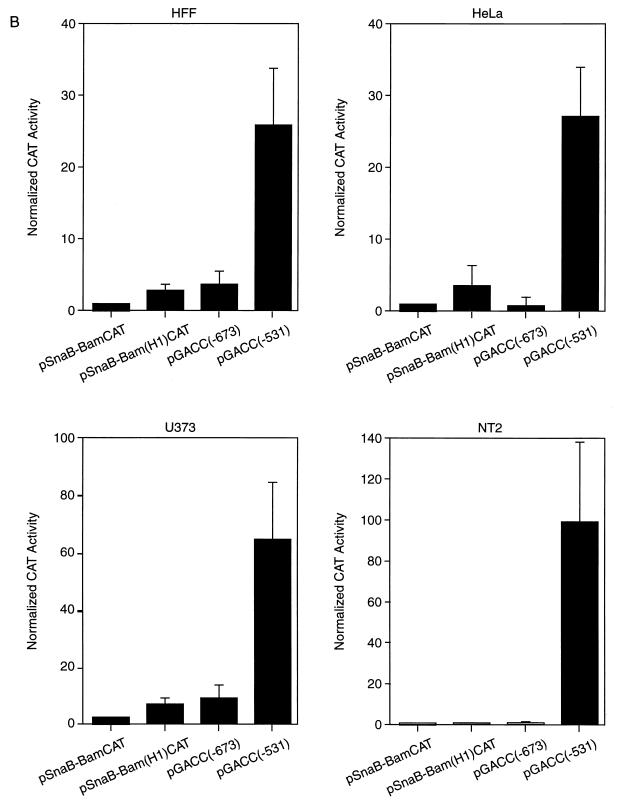
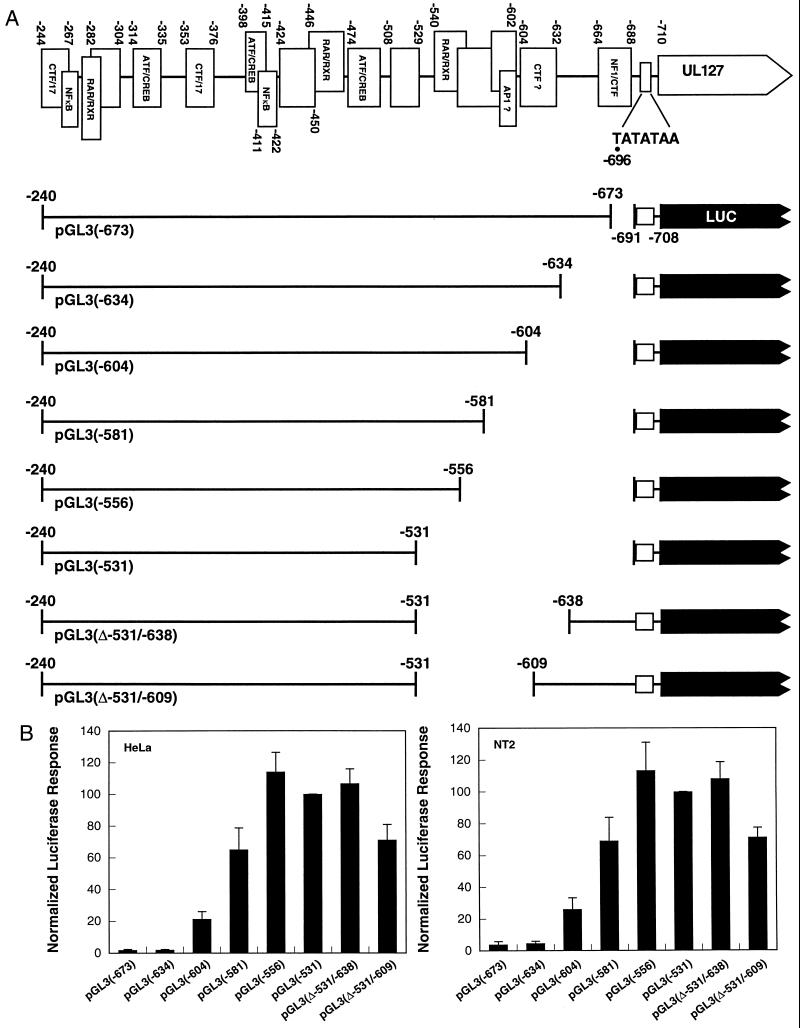
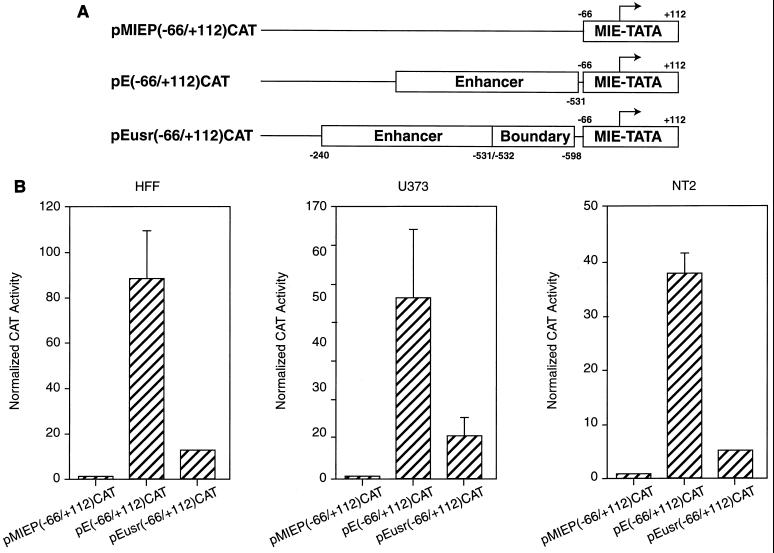
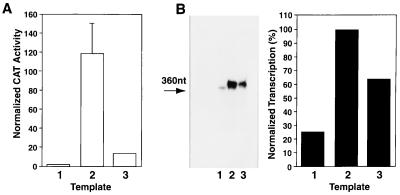
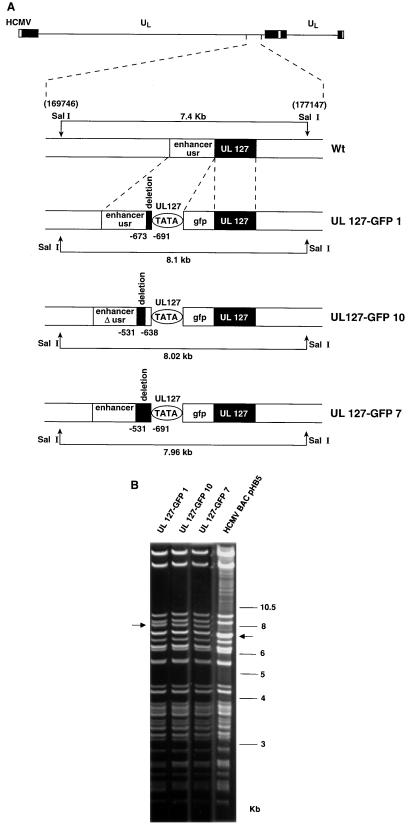
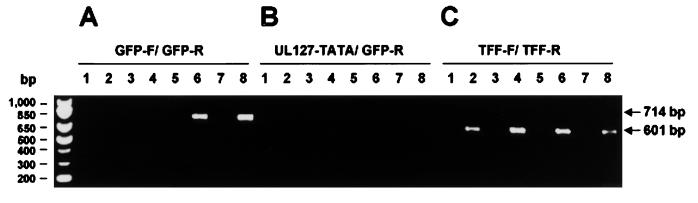
Transcriptional repression within a complex modular promoter may play a key role in determining the action of enhancer elements. In human cytomegalovirus, the major immediate-early promoter (MIEP) locus contains a highly potent and complex modular enhancer. Evidence is presented suggesting that sequences of the MIEP between nucleotide positions -556 and -673 function to prevent transcription activation by enhancer elements from the UL127 open reading frame divergent promoter. Transient transfection assays of reporter plasmids revealed repressor sequences located between nucleotides -556 and -638. The ability of these sequences to confer repression in the context of an infection was shown using recombinant viruses generated from a bacterial artificial chromosome containing an infectious human cytomegalovirus genome. In addition to repressor sequences between -556 and -638, infection experiments using recombinant virus mutants indicated that sequences between -638 and -673 also contribute to repression of the UL127 promoter. On the basis of in vitro transcription and transient transfection assays, we further show that interposed viral repressor sequences completely inhibit enhancer-mediated activation of not only the homologous but also heterologous promoters. These and other experiments suggest that repression involves an interaction of host-encoded regulatory factors with defined promoter sequences that have the property of proximally interfering with upstream enhancer elements in a chromatin-independent manner. Altogether, our findings establish the presence of a boundary domain that efficiently blocks enhancer-promoter interactions, thus explaining how the enhancer can work to selectively activate the MIEP.


Figures

FIG. 1
FIG. 1
Schematic diagrams of the HCMV and MCMV genomes. Fragments containing the MIE regions are expanded below the corresponding regions of the genomes. Locations and direction of transcription of the ORFs for the MIE genes ie1, ie2, and ie3 and the potential UL127 ORF are indicated. The gray box depicts the enhancer. The TATA box sequences of the different ORFs are shown. The diagram is not drawn to scale.
FIG. 2
FIG. 2
NF-1 binding sites flanking the UL127 TATA box do not mediate transcriptional repression. (A) Binding of various transcription factors (marked by open boxes) to HCMV MIEP sequences between −244 and −781 (based on DNase I footprinting data [reviewed in reference 20]). Locations of the enhancer, usr, NF-1 cluster, modulator, and UL127 TATA box are shown. Numbers refer to nucleotide positions relative to the transcription start site (+1) of the MIEP. CAT reporter constructs [pSnab-BamCAT, pSnab-Bam(HI)CAT, pGACC(−673), and pGACC(−531] with various 5′ and 3′ deletion endpoints are shown below. (B) HFF, HeLa, U373-MG, and NT-2/D1 cells were transfected with 5 μg of the various promoter-CAT deletion constructs shown in panel A together with 5 μg of the control plasmid pRSV-β-gal. Cell lysates were prepared 30 h after transfection and assayed for β-galactosidase and CAT activity. For the CAT assays, cell extracts containing the same amount of β-galactosidase activity were used. A plot of the normalized percentage of CAT activity calculated for each construct taking as 1 the activity presented by pSnaB-BamCAT is shown. The CAT values shown represent the average ± standard deviation (bars) of three determinations.
FIG. 2
FIG. 2
NF-1 binding sites flanking the UL127 TATA box do not mediate transcriptional repression. (A) Binding of various transcription factors (marked by open boxes) to HCMV MIEP sequences between −244 and −781 (based on DNase I footprinting data [reviewed in reference 20]). Locations of the enhancer, usr, NF-1 cluster, modulator, and UL127 TATA box are shown. Numbers refer to nucleotide positions relative to the transcription start site (+1) of the MIEP. CAT reporter constructs [pSnab-BamCAT, pSnab-Bam(HI)CAT, pGACC(−673), and pGACC(−531] with various 5′ and 3′ deletion endpoints are shown below. (B) HFF, HeLa, U373-MG, and NT-2/D1 cells were transfected with 5 μg of the various promoter-CAT deletion constructs shown in panel A together with 5 μg of the control plasmid pRSV-β-gal. Cell lysates were prepared 30 h after transfection and assayed for β-galactosidase and CAT activity. For the CAT assays, cell extracts containing the same amount of β-galactosidase activity were used. A plot of the normalized percentage of CAT activity calculated for each construct taking as 1 the activity presented by pSnaB-BamCAT is shown. The CAT values shown represent the average ± standard deviation (bars) of three determinations.
FIG. 3
FIG. 3
Identification of the sequences that mediate transcriptional repression of the UL127 promoter. (A) Binding of various transcription factors (marked by open boxes) to HCMV-MIEP sequences between −244 and −710 (based on DNase I footprinting data [reviewed in reference 20]). The location of the UL127 TATA box is shown. Numbers refer to nucleotide positions relative to the transcription start site (+1) of the MIEP. Luciferase (LUC) reporter constructs with various 5′ and 3′ deletion endpoints are shown below. (B) HeLa and NT-2/D1 cells were transfected with 5 μg of the various promoter deletion luciferase constructs shown in panel A together with 5 μg of the control plasmid pRL-tk. Cell lysates were prepared 30 h after transfection and assayed for luciferase activity. The activity of each promoter deletion reporter construct was normalized to the activity of the internal control plasmid. A plot of the normalized percentage of luciferase activity calculated for each construct, taking as 100 the activity presented by pGL3(−531), is shown. The luciferase values shown represent the average ± standard deviation (bars) of three determinations.
FIG. 4
FIG. 4
Boundary domain sequences within the UL127 promoter confer repression on a heterologous promoter. (A) Schematic representation of constructs pMIEP(−66/+112)CAT, pE(−66/+112)CAT, and pEusr(−66/+112)CAT. Numbers refer to nucleotide positions relative to the MIEP transcription start site (+1, indicated by an arrow). The enhancer region, the boundary segment, and the core promoter containing the MIEP TATA box are shown. (B) HFF, U373-MG, and NT-2/D1 cells were transfected with 5 μg of either pMIEP(−66/+112)CAT, pE(−66/+112)CAT, or pEusr(−66/+112)CAT along with 5 μg of the control plasmid pRSV-β-gal. Transfections and CAT assays were performed as described in the legend to Fig. 2 and in Materials and Methods. A plot of the normalized percentage of CAT activity calculated for each construct, taking as 1 the activity presented by pMIEP(−66/+112), is shown. The CAT values shown represent the average ± standard deviation (bars) of three determinations.
FIG. 5
FIG. 5
Boundary domain sequences within the UL127 promoter mediate repression in an in vitro transcription system. (A) HeLa cells were transfected with 5 μg of either pMIEP(−66/+112)CAT (lane 1), pE(−66/+112)CAT (lane 2), or pEusr(−66/+112)CAT (lane 3) along with 5 μg of the control plasmid pRSV-β-gal. Transfections and CAT assays were performed as described in the legend to Fig. 2 and in Materials and Methods. A plot of the normalized percentage of CAT activity calculated for each construct, taking as 1 the activity presented by pMIEP(−66/+112), is shown. (B) In vitro runoff transcription assays with different DNA templates, pMIEP(−66/+112)CAT (lane 1), pE(−66/+112)CAT (lane 2), and pEusr(−66/+112)CAT (lane 3), linearized with EcoRI. The transcription reactions were performed, processed, and subjected to polyacrylamide gel electrophoresis (18). The 360-nt specific runoff transcript is indicated by an arrow. The specific runoff transcripts were normalized to an internal control, and the amount of transcript was determined by PhosphorImager analysis (42). A plot of the normalized percentage of specific transcription for each DNA template, taking as 100 the activity developed by pE(−66/+112)CAT, is shown.
FIG. 6
FIG. 6
Construction of UL127-GFP HCMV BAC recombinant genomes. (A) The top line represents the parental (wt) HCMV genome with the SalI fragment (nt 169746 to 177147 [11]) containing the MIE region expanded below. Sequences corresponding to the enhancer and usr (open rectangle) and the UL127 ORF (black box) are indicated. Recombinant HCMV BAC genomes, UL127-GFP1, UL127-GFP10, and UL127-GFP7, containing the GFP ORF (open rectangle) under the control of the various UL127 promoter deletion mutants are shown. UL127 promoter deletions are indicated by black boxes, and the coordinates for these deletions relative to the HCMV ie1/ie2 transcription start site are shown. The diagram is not drawn to scale. (B) Ethidium bromide-stained agarose gels of SalI-digested BAC plasmids UL127-GFP1, UL127-GFP10, UL127-GFP7, and parental HCMV BAC (pHB5) after separation on a 0.5% agarose gel. Positions of size markers are shown at the right; sizes of the natural and new SalI fragments for each virus are shown with arrows.
FIG. 7
FIG. 7
Detection of GFP transcripts in HFF cells infected with UL127-GFP HCMV recombinants. HFF cells were infected at an MOI of 0.1 with parental HCMV (RVHB5; lanes 1 and 2), UL127-GFP1 (lanes 3 and 4), UL127-GFP10 (lanes 5 and 6), and UL127-GFP7 (lanes 7 and 8). Total RNA was harvested at 13 hpi, treated with DNase, and reverse transcribed by using oligo(dT). PCR was performed using three different primer sets: one containing a 3′ primer that anneals within the GFP gene, GFP-R, and a 5′ primer situated 29 to 55 bp downstream the predicted UL127 TATA box, GFP-F (A); one containing primer GFP-R and a 5′ primer located within the predicted UL127 TATA box, UL127-TATA (B), and one specific for the human tissue factor gene (C). Amplified products were separated on a 1% agarose gel and visualized by ethidium bromide staining. Shown are products obtained in reactions containing RT (lanes 2, 4, 6, and 8) and in control reactions in which RT was not added (lanes 1, 3, 5, and 7). Position of size markers are shown at the left; sizes of the amplified products are indicated by arrows.
FIG. 8
FIG. 8
Confocal microscopy of HFF cells infected with UL127-GFP HCMV recombinants. HFF cells were infected with parental HCMV (RVHB5; A), UL127-GFP1 (B), UL127-GFP10 (C), and UL127-GFP7 (D) at an MOI of 0.5 PFU/cell. Three days after infection, cells were fixed, permeabilized, and subjected to immunofluorescence using an HCMV IE monoclonal antibody and a TRITC–anti-mouse secondary conjugate. Expression of MIE proteins can be visualized in panels 1 (red), expression of GFP is evident in panels 2 (green), and panels 3 show the merge of panels 1 and 2. Magnification, ×63.
FIG. 9
FIG. 9
GFP expression from UL127 GFP HCMV recombinants. HFF cells were infected with UL127-GFP1, UL127-GFP10, and UL127-GFP7 at an MOI of 0.5 PFU/cell. On day 3 postinfection, cells were trypsinized and fixed with 1% formaldehyde. Fluorescence was measured by flow cytofluorometry as described in Materials and Methods. A histogram of FL1 versus the log fluorescence intensity (detected at 530 nm) is shown. A total of 10,000 events were collected for each sample. Mean fluorescence intensities with signal-to-noise ratios of 25.4/19.8, 134.6/18.8, and 222.1/15.8 were obtained for UL127-GFP1, UL127-GFP10, and UL127-GFP7, respectively.
FIG. 10
FIG. 10
Sites of protein-DNA interaction on MIEP sequences between −538 and −738. Sequences between −556 and −638, corresponding to the repressor region defined in transient transfection assays, are marked by reverse print. Sequences from −638 to −673, shown to contribute to repression of the UL127 promoter in the context of the infection, are marked by a gray box. Black underlining represents the extent of strong protection observed using the phosphocellulose (p11) gel chromatography fractions P11 0.3, P11 0.6, and P11 1 (18). The cellular factors known to interact with the protected sequences are indicated. The UL127 TATA box is shown. Numbers refer to nucleotide positions relative to the transcription start site (+1) of the MIEP.

References

    1. Adhya S, Geanacopoulos M, Lewis D E, Roy S, Aki T. Transcription regulation by repressosome and by RNA polymerase contact. Cold Spring Harbor Symp Quant Biol. 1998;63:1–9. - PubMed
    1. Angulo A, Suto C, Heyman R A, Ghazal P. Characterization of the sequences of the human cytomegalovirus enhancer that mediate differential regulation by natural and synthetic retinoids. Mol Endocrinol. 1996;10:781–793. - PubMed
    1. Angulo A, Messerle M, Koszinowski U H, Ghazal P. Enhancer requirement for murine cytomegalovirus growth and genetic complementation by the human cytomegalovirus enhancer. J Virol. 1998;72:8502–8509. - PMC - PubMed
    1. Baskar J F, Smith P P, Climent G S, Hoffman S, Tucker C, Tenney D J, Colberg-Poley A M, Nelson J A, Ghazal P. Developmental analysis of the cytomegalovirus enhancer in transgenic animals. J Virol. 1996;70:3215–3226. - PMC - PubMed
    1. Baskar J F, Smith P P, Nilaver G, Jupp R A, Hoffmann S, Peffer N J, Tenney D J, Colberg-Poley A M, Ghazal P, Nelson J. The enhancer domain of the human cytomegalovirus major immediate-early promoter determines cell-type-specific expression in transgenic mice. J Virol. 1996;70:3207–3214. - PMC - PubMed

Publication types

LinkOut - more resources