. 2000 Mar 1;20(5):1883-92.
doi: 10.1523/JNEUROSCI.20-05-01883.2000.

Disruption of the olfactoretinal centrifugal pathway may relate to the visual system defect in night blindness b mutant zebrafish

Affiliations

Disruption of the olfactoretinal centrifugal pathway may relate to the visual system defect in night blindness b mutant zebrafish

L Li et al. J Neurosci. .

Abstract

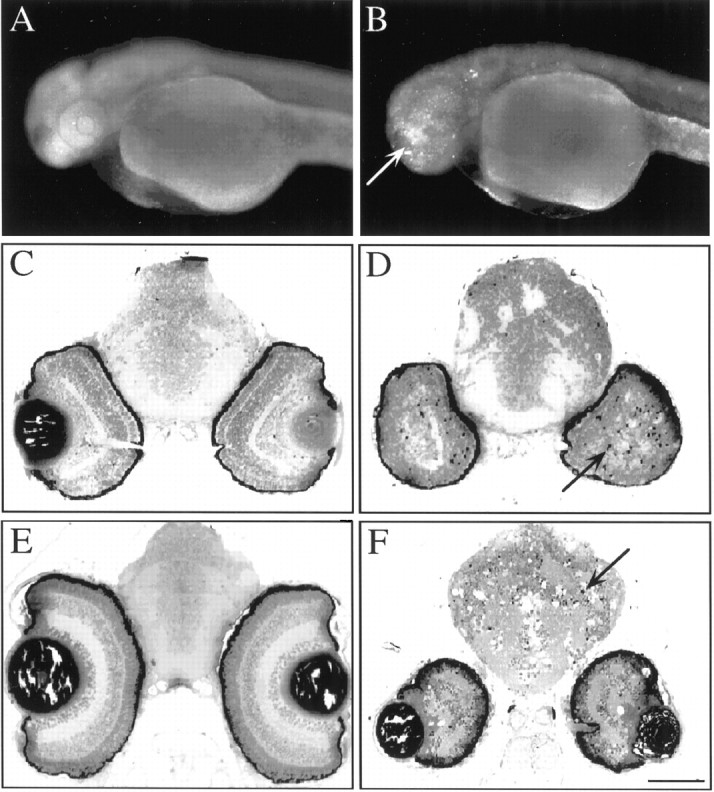
We describe here a dominant mutation, night blindness b (nbb), which causes an age-related visual system defect in zebrafish. At 4-5 months of age, dark-adapted nbb(+/-) mutants show abnormal visual threshold fluctuations when measured behaviorally. Light sensitizes the animals; thus early dark adaptation of nbb(+/-) fish is normal. After 2 hr of dark adaptation, however, visual thresholds of nbb(+/-) mutants are raised on average 2-3 log units, and rod system function is not detectable. Electroretinograms recorded from nbb(+/-) mutants are normal, but ganglion cell thresholds are raised in prolonged darkness, suggesting an inner retinal defect. The visual defect of nbb(+/-) mutants may be likely caused by an abnormal olfactoretinal centrifugal innervation; in nbb(+/-) mutants, the olfactoretinal centrifugal projection to the retina is disrupted, and the number of retinal dopaminergic interplexiform cells is reduced. A similar visual defect as shown by nbb(+/-) mutants is observed in zebrafish in which the olfactory epithelium and olfactory bulb have been excised. Homozygous nbb fish display an early onset neural degeneration throughout the CNS and die by 7-8 d of age.


Figures

Fig. 1.
Fig. 1.
Behavioral visual thresholds of wild-type andnbb+/fish. A, Behavioral visual thresholds of a wild-type fish (9.5 months old, ●) and the originalnbb+/mutant (9.5 months old, ○) determined at the same time (∼6 P.M.) on 5 different days. Each circle indicates a behavioral visual threshold measurement. Note the threshold fluctuation in thenbb+/mutant when measured on different days. The horizontal dashed line drawn at log I = −5.5 indicates the highest threshold level of wild-type fish when measured at 6 P.M.B, Dark adaptation curves of wild-type (●,n = 12) andnbb+/fish (○, n = 12) measured during late afternoon–early evening hours. For the first 26 min, visual thresholds were similar between wild-type and mutant fish. Threshold elevations were observed innbb+/fish when measured at 1, 2, 4, and 6 hr of dark adaptation. Data represent the means ± SD. C, Visual thresholds of wild-type (●, n = 6) andnbb+/fish (○, n = 10) measured with white (left panel), red (middle panel), or green (right panel) light. Eachcircle indicates a behavioral visual threshold measurement. Note the similarity in visual thresholds ofnbb+/mutants when measured using white, red, and green lights.
Fig. 2.
Fig. 2.
Behavioral visual thresholds of wild-type andnbb+/fish as a function of time in dark. A, Visual thresholds ofnbb+/fish (○, n = 14) during dark adaptation after bright light adaptation (indicated by the first open barshown on the top of the figure). Eachcircle indicates a behavioral visual threshold measurement. Note that at 2, 4, and 6 hr, some of thenbb+/fish showed no response to visual stimuli at 3 log units above the absolute threshold level of wild-type fish (shown above thehorizontal dashed line drawn at logI = −3.0). The elevated visual thresholds were decreased by exposure to light (the second open barshown on the top of the figure). The black bars shown on the top of the figure indicate darkness. Filled circles indicate the average visual threshold of wild-type fish kept in the same illuminating conditions.B, Visual thresholds of individualnbb+/mutant fish (numbered 1-4) measured at various times in the dark. Each circleindicates a behavioral visual threshold measurement. Note the threshold fluctuations in fish 1, 2, and 4 when measured at different times in the dark. C, Behavioral visual thresholds of wild-type (●, n = 6) andnbb+/fish (○, n = 12) measured at subjective dawn and subjective dusk, Animals were kept in constant dark during the experiment. Each circle indicates a behavioral visual threshold measurement. The thresholds measured at subjective dawn were similar between wild-type andnbb+/fish. Significant threshold elevations were observed innbb+/mutants when measured at subjective dusk.
Fig. 3.
Fig. 3.
ERG and ganglion cell recordings.A, Representative ERGs recorded from 2 hr dark-adapted wild-type andnbb+/fish at dusk. Over a range of 6 log units of stimuli, the ERGs were similar between wild-type andnbb+/animals. a, a-wave; b, b-wave. The light responses were averaged 6–10 times to increase the response to noise ratio. Calibration bars (bottom) signify 200 msec horizontally and 100 μV vertically. B, Representative histograms of ganglion cell discharges from wild-type and mutant zebrafish elicited with a full-field flash (intensity, logI = −3.0). Note both on andoff responses to the 0.5 sec flash. C, Threshold light levels that were required to fire action potentials of retinal ganglion cells in wild-type (●, n = 6) andnbb+/fish (○, n = 11) measured at 20 min and 2 hr of dark adaptation. Each circle indicates a visual threshold measurement. Note the threshold elevation innbb+/mutants at 2 hr of dark adaptation. The horizontal dashed line drawn at log I = −5.75 indicates the highest threshold level of wild-type fish.
Fig. 4.
Fig. 4.
Histological sections of the retina from wild-type (A) andnbb+/fish (B) showing the inner nuclear layer. Note that in the lower portion of the inner nuclear layer more swollen cells and/or empty spaces (arrows) were observed innbb+/than in wild-type retinas. Scale bar, 50 μm.
Fig. 5.
Fig. 5.
The olfactoretinal centrifugal pathway in zebrafish. A, A schematic drawing of the forebrain and midbrain of zebrafish (dorsal view). TNs (red circles) are found in the anterior/ventral part of the olfactory bulb. Most TN axons are found in TE and TC.B, C, and D highlight the olfactory bulb, the optic nerve, and the retina, respectively, as indicated in A. OE, Olfactory epithelium;ON, olfactory nerve; OB, olfactory bulb;OP, optic nerve; TE, telencephalon;TC, tectum; RE, retina. B, A whole-mount olfactory bulb (outlined by the dashed line; anterior is up) stained with an antibody against FMRFamide. Both TN cell bodies and axons were stained (arrows). C, FMRFamide immunostaining of a retinal section showing CFs in the optic nerve (vertical arrows) and in the retina (horizontal arrows). Photoreceptor cells (top left) were nonspecifically labeled. D, A double-labeled retinal section showing the CFs (red) and DA-IPCs (green,arrows). CFs and DA-IPCs were identified using antibodies against FMRFamide and tyrosine hydroxylase, respectively. Photoreceptor cells (top) were nonspecifically labeled.PH, Photoreceptor cell layer; OP, outer plexiform layer; IN, inner nuclear layer;IP, inner plexiform layer. Scale bars: B, 100 μm; C, D, 30 μm.
Fig. 6.
Fig. 6.
Flat-mounted wild-type (A,C) andnbb+/(B, D) retinas. A,B, Schematic drawing of representative CF distribution in wild-type (A) andnbb+/(B) retinas. Dorsal is up; nasal is to the left. The black circles marked in the middle of the retina indicate the optic disk. Note the disruption and reduction of CFs in thenbb+/retina. C, D, Confocal images taken from nasal/ventral regions (inset boxes in Aand B) of double-labeled wild-type (C) andnbb+/(D) retinas. CFs are shown in red, and DA-IPCs are shown in green. Note the disruption and reduction of CFs and the reduction of DA-IPCs in thenbb+/retina. Scale bar, 100 μm.
Fig. 7.
Fig. 7.
Behavioral visual thresholds of control (4.5 months old, ●, n = 10) and OE/OB-excised animals (4.5 months old, ○, n = 6) measured during late afternoon–early evening hours. A, Dark adaptation curves of the control and experimental animals in 26 min. Note the similarity in visual threshold between the control and experimental animals. Data represent the means ± SD. B, Visual thresholds of experimental animals (○) during prolonged darkness. Each circle indicates a behavioral visual threshold measurement. Note the threshold elevation after 1, 2, and 4 hr of dark adaptation. Some of the experimental animals showed no response to visual stimuli 3 log units above the absolute threshold level of wild-type fish (shown above the horizontal dashed lineat log I = −3.0). Filled circlesindicate the average visual thresholds of wild-type fish kept under the same illuminating conditions.
Fig. 8.
Fig. 8.
Photographs of whole-mount zebrafish embryos (A, B) and histological sections of the brain and retinas (C–F). A,B, Photographs of 2.5-d-old wild-type (A) andnbb/(B) embryos stained with acridine orange. Note the stained cells in the forebrain and eyes ofnbb/embryos (bright staining in B,arrow). C–F, Histological sections of the brain and retinas of wild-type (C, E) andnbb/(D, F) fish. At 3 d of age (C, D), apoptotic cells were detected in the brain and retinas innbb/embryos (D, arrow). By 7 d (E, F), the sizes of the brain and retinas innbb/embryos were further reduced. Many cells had died (F,arrow). Scale bars: A, B, 250 μm; CF, 100 μm.

Similar articles

Cited by

References

    1. Arey LB. The function of the afferent fibers of the optic nerve of fishes. J Comp Neurol. 1916;26:213–245.
    1. Baier H, Klostermann S, Trowe T, Karlstrom RO, Nusslein-Volhard C, Bonhoeffer F. Genetic dissection of the retinotectal projection. Development. 1996;123:415–425. - PubMed
    1. Branchek T, Bremiller R. The development of photoreceptors in the zebrafish, Branchydanio rerio. I. Structure. J Comp Neurol. 1984;224:107–115. - PubMed
    1. Brockerhoff SE, Hurley JB, Janssen-Bienhold U, Neuhauss SCF, Driever W, Dowling JE. A behavioral screen for isolating zebrafish mutants with visual system defects. Proc Natl Acad Sci USA. 1995;92:10545–10549. - PMC - PubMed
    1. Brockerhoff SE, Hurley JB, Niemi GA, Dowling JE. A new form of inherited red-blindness identified in zebrafish. J Neurosci. 1997;17:4236–4242. - PMC - PubMed

Publication types

MeSH terms

LinkOut - more resources