Comparative Study
. 2000 Mar 15;28(6):1481-8.
doi: 10.1093/nar/28.6.1481.

Analysis of the yeast transcriptome with structural and functional categories: characterizing highly expressed proteins

Affiliations
Comparative Study

Analysis of the yeast transcriptome with structural and functional categories: characterizing highly expressed proteins

R Jansen et al. Nucleic Acids Res. .

Abstract

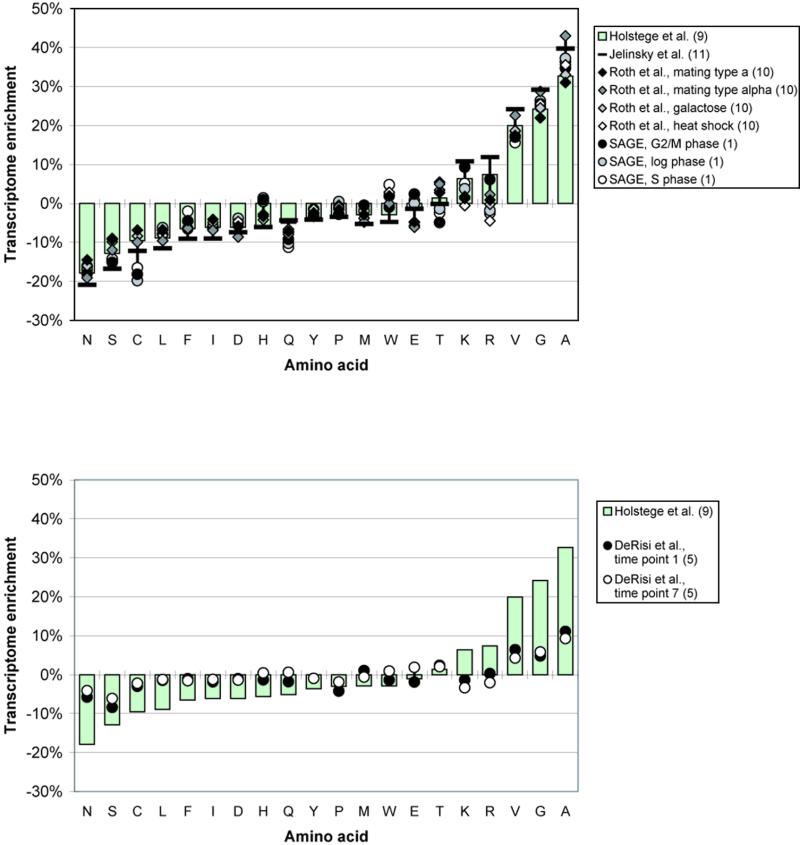
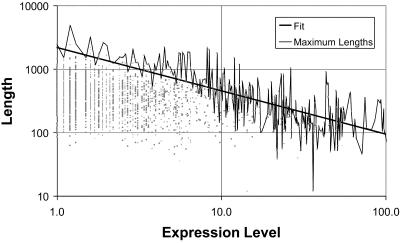
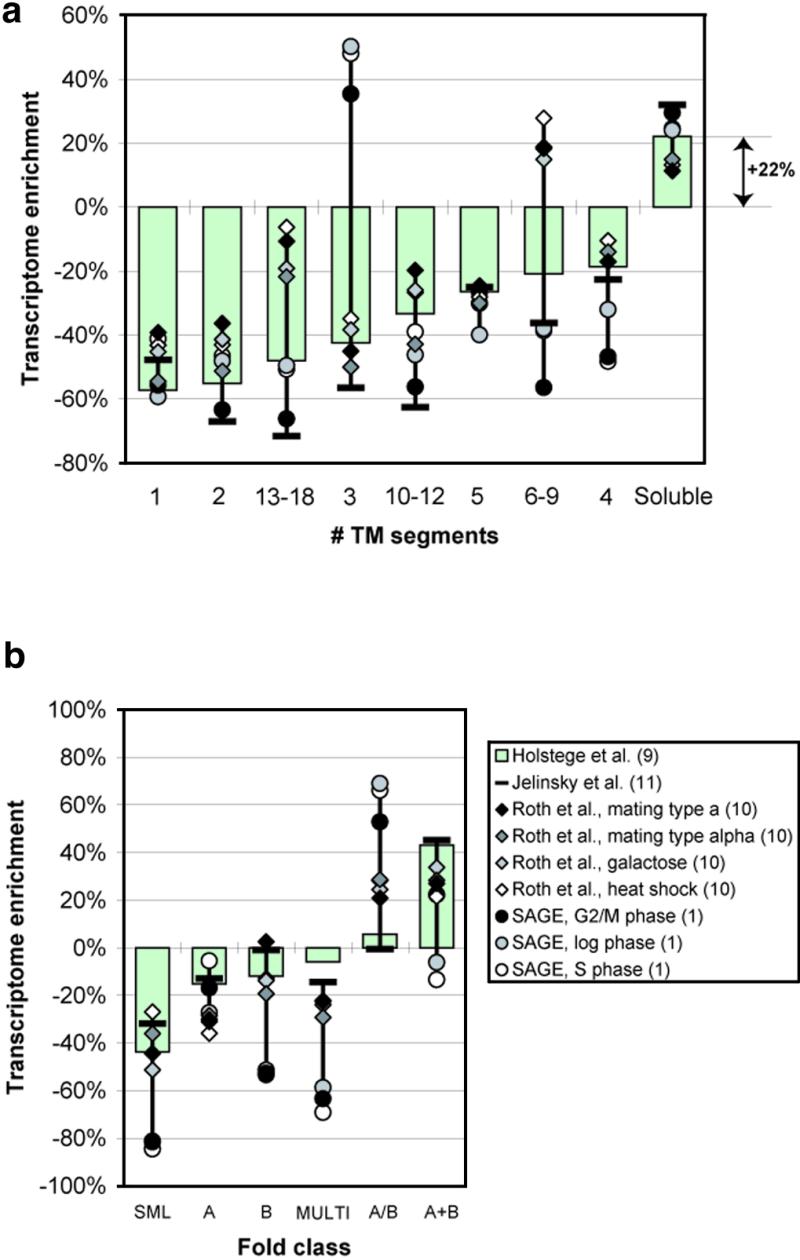
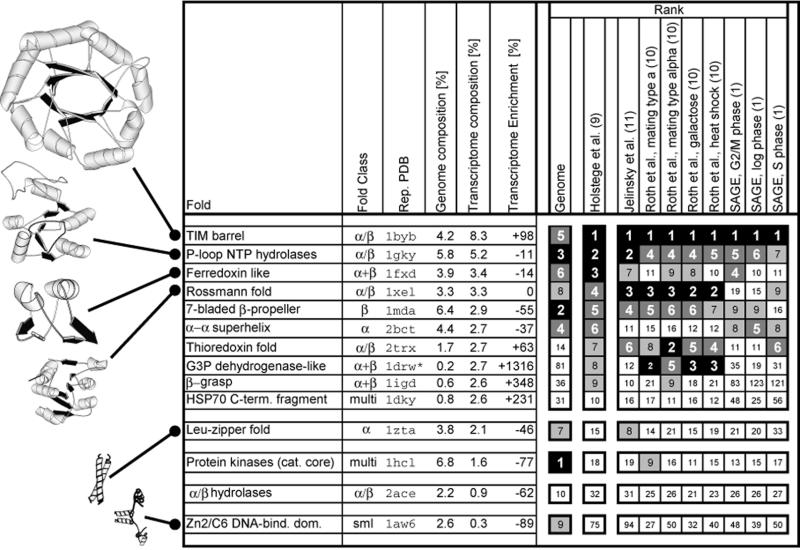
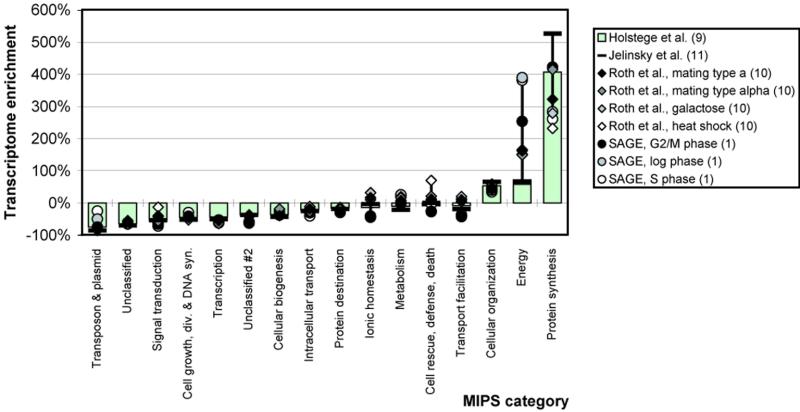
We analyzed 10 genome expression data sets by large-scale cross-referencing against broad structural and functional categories. The data sets, generated by different techniques (e.g. SAGE and gene chips), provide various representations of the yeast transcriptome (the set of all yeast genes, weighted by transcript abundance). Our analysis enabled us to determine features more prevalent in the transcriptome than the genome: i.e. those that are common to highly expressed proteins. Starting with simplest categories, we find that, relative to the genome, the transcriptome is enriched in Ala and Gly and depleted in Asn and very long proteins. We find, furthermore, that protein length and maximum expression level have a roughly inverse relationship. To relate expression level and protein structure, we assigned transmembrane helices and known folds (using PSI-blast) to each protein in the genome; this allowed us to determine that the transcriptome is enriched in mixed alpha-beta structures and depleted in membrane proteins relative to the genome. In particular, some enzymatic folds, such as the TIM barrel and the G3P dehydrogenase fold, are much more prevalent in the transcriptome than the genome, whereas others, such as the protein-kinase and leucine-zipper folds, are depleted. The TIM barrel, in fact, is overwhelmingly the 'top fold' in the transcriptome, while it only ranks fifth in the genome. The most highly enriched functional categories in the transcriptome (based on the MIPS system) are energy production and protein synthesis, while categories such as transcription, transport and signaling are depleted. Furthermore, for a given functional category, transcriptome enrichment varies quite substantially between the different expression data sets, with a variation an order of magnitude larger than for the other categories cross-referenced (e.g. amino acids). One can readily see how the enrichment and depletion of the various functional categories relates directly to that of particular folds.


Figures

Figure 1
Figure 1
Transcriptome enrichment of amino acids. (a) Amino acids are ordered along the x-axis according to the transcriptome enrichment found for the reference data set of Holstege et al. (9). Although the results vary between the different expression data sets, they all follow a general trend. Most notably, the composition of Ala increases by ~30–40% whereas the composition of Asn decreases by ~20%. The transcriptome is also significantly enriched in Gly and the positively charged amino acids, Arg and Lys. (b) Transcriptome enrichment calculated for the cDNA microarray expression data of the diauxic shift in yeast (5). The data from this experiment is primarily used for the measurement of expression level changes and we show the transcriptome enrichment only for purely illustrative purposes. Here we use the red fluorescence intensity minus the background intensity as measured by DeRisi et al. (5) as a crude approximation of the absolute expression level of a given ORF. We look at both time point 1 (fermentation) and time point 7 (respiration) of the experiment.
Figure 2
Figure 2
Dependence of expression level on gene length. We plotted protein length versus expression level for the reference data set of Holstege et al. (9) (for the other data sets, see http://bioinfo.mbb.yale.edu/genome/expression ). Each point on the graph represents one ORF and the axes of the graph are on a logarithmic scale. It is obvious that there is no strong positive or negative correlation between protein length and expression level (correlation coefficient is –0.16). However, it seems that protein length is related to the upper limit of the expression level possible for a given group of ORFs. A rough way to characterize this upper limit is to fit the hypberbolic function L = (K/E)A through the maximum protein lengths L (in units of amino acid residues) at given expression levels E (in units of transcripts per cell); K and A are constants. For the reference set of Holstege et al., parameter A was determined to be ~0.7 and K ~4.7 × 10⁴. The following table lists the values for parameters A and K for all data sets. As can be seen in Figure 2 (especially on the left-hand side), the expression data is discrete, which makes the functional fit possible; this is due to the resolution limit of the experimental data [0.1 copies per cell for the data set of Holstege et al. (9)]. Different data discretizations affect the slope of the straight line somewhat (that is, parameter A), but the general trend can always be observed.
Figure 2
Figure 2
Dependence of expression level on gene length. We plotted protein length versus expression level for the reference data set of Holstege et al. (9) (for the other data sets, see http://bioinfo.mbb.yale.edu/genome/expression ). Each point on the graph represents one ORF and the axes of the graph are on a logarithmic scale. It is obvious that there is no strong positive or negative correlation between protein length and expression level (correlation coefficient is –0.16). However, it seems that protein length is related to the upper limit of the expression level possible for a given group of ORFs. A rough way to characterize this upper limit is to fit the hypberbolic function L = (K/E)A through the maximum protein lengths L (in units of amino acid residues) at given expression levels E (in units of transcripts per cell); K and A are constants. For the reference set of Holstege et al., parameter A was determined to be ~0.7 and K ~4.7 × 10⁴. The following table lists the values for parameters A and K for all data sets. As can be seen in Figure 2 (especially on the left-hand side), the expression data is discrete, which makes the functional fit possible; this is due to the resolution limit of the experimental data [0.1 copies per cell for the data set of Holstege et al. (9)]. Different data discretizations affect the slope of the straight line somewhat (that is, parameter A), but the general trend can always be observed.
Figure 3
Figure 3
Transcriptome enrichment of structural classes. (a) Transcriptome enrichment of membrane proteins compared with soluble proteins. We identified yeast ORFs coding for membrane proteins using the GES hydrophobicity scale (33). The values from this scale in a window of size 20 (the typical size of a transmembrane helix) were averaged and then compared against a cut-off of –1 kcal/mol. A value under this cut-off was taken to indicate the existence of a transmembrane helix. Initial hydrophobic stretches corresponding to signal sequences for membrane insertion were excluded (these have the pattern of a charged residue within the first seven, followed by a stretch of 14 with an average hydrophobicity under the cut-off). These parameters have been used, tested and refined in surveys of membrane proteins in genomes (20,34–36). ‘Sure’ membrane proteins had at least one TM segment with an average hydrophobicity less than –2 kcal/mol. ‘Marginal’ membrane proteins had GES-identified TM helices but did not fulfil this ‘MinH’ criteria. This approach is similar to Boyd and Beckwith’s MaxH criteria (37) and to the approach of Klein et al. (38). (b) Transcriptome enrichment of soluble fold classes. The fold classes are sorted along the x-axis in the order of increasing transcriptome enrichment for the reference data set. To assign folds to the yeast genome, we followed a protocol similar to the one described previously, matching the PDB structure database against the yeast genome using both PSI-blast and FASTA (23,31,39–43). We used the following parameters in our PSI-blast searches: an inclusion threshold (h) of 10–5, the maximum number of iterations (j) of 10 and a final e-value cut-off of 10–4. These parameters are somewhat stricter than those used in previous PSI-blast analyses: e.g. our inclusion parameter is ~1/20 of that in Teichmann et al. (1998) (44) (who used 5 × 10⁻⁴ and j = 20); the inclusion parameter determines to which degree further homologs of a sequence are included at the next PSI-blast iteration. (A higher value leads to the inclusion of more sequences and greater coverage. However, an inclusion too high can lead to a corrupted profile and spurious matches.) We monitored our parameter settings by looking at how many domains were assigned to two different protein folds (obviously an erroneous assignment) and made sure this number was virtually nil. For the FASTA searches we used the usual e-value cut-off of 10–2 used in previous analyses (43).
Figure 4
Figure 4
The 10 most highly expressed protein folds in yeast. The folds are listed from top to bottom in the order of decreasing transcriptome composition for the reference data set of Holstege et al. (9). In the left half of the table we first list the protein fold, then its fold class and the identifier for a representative structure in the Protein Data Bank (PDB) (22). In the columns ‘genome’, ‘transcriptome’ and ‘transcriptome enrichment’ we list the genome and transcriptome compositions and the transcriptome enrichment of each fold, respectively. The right half of the table shows the rankings of each fold based on its transcriptome composition in the different expression data sets. For comparison we also show the ranking in the genome: i.e. based purely on the level of duplication within the genome. The genome compositions are calculated with respect to the ORFs for which expression levels in the reference data set exist. Their exact fractions in the transcriptome are listed for the reference data set and are schematized with rankings for the other sets. The ranking of the most common folds in the transcriptome and the genome are different. For instance, the most common transcriptome fold by a large margin (8 versus 5% for the 2nd ranked fold) is the TIM barrel, which is only ranked fifth in the genome. The second domain of this two-domain protein represents a G3P dehydrogenase-like fold.
Figure 5
Figure 5
5. Transcriptome enrichment of MIPS categories. To analyze the transcriptome in terms of broad functional categories, we categorized the yeast ORFs using the functional categorization provided by MIPS (28–30). The functional categories are sorted along the x-axis in the order of increasing transcriptome enrichment for the reference data set.

References

    1. Velculescu V.E., Zhang,L., Zhou,W., Vogelstein,J., Basrai,M.A., Bassett,D.E.,Jr, Hieter,P., Vogelstein,B. and Kinzler,K.W. (1997) Cell, 88, 243–251. - PubMed
    1. Goffeau A., Barrell,B.G., Bussey,H., Davis,R.W., Dujon,B., Feldmann,H., Galibert,F., Hoheisel,J.D., Jacq,C., Johnston,M., Louis,E.J., Mewes,H.W., Murakami,Y., Philippsen,P., Tettelin,H. and Oliver,S.G. (1996) Science, 274, 546, 563–567. - PubMed
    1. Schena M., Shalon,D., Davis,R.W. and Brown,P.O. (1995) Science, 270, 467–470. - PubMed
    1. Shalon D., Smith,S.J. and Brown,P.O. (1996) Genome Res., 6, 639–645. - PubMed
    1. DeRisi J.L., Iyer,V.R. and Brown,P.O. (1997) Science, 278, 680–686. - PubMed

Publication types

MeSH terms