Comparative Study
. 2000 Mar 14;97(6):2779-84.
doi: 10.1073/pnas.050569097.

Rat strain-specific actions of 17beta-estradiol in the mammary gland: correlation between estrogen-induced lobuloalveolar hyperplasia and susceptibility to estrogen-induced mammary cancers

Affiliations
Comparative Study

Rat strain-specific actions of 17beta-estradiol in the mammary gland: correlation between estrogen-induced lobuloalveolar hyperplasia and susceptibility to estrogen-induced mammary cancers

D M Harvell et al. Proc Natl Acad Sci U S A. .

Abstract

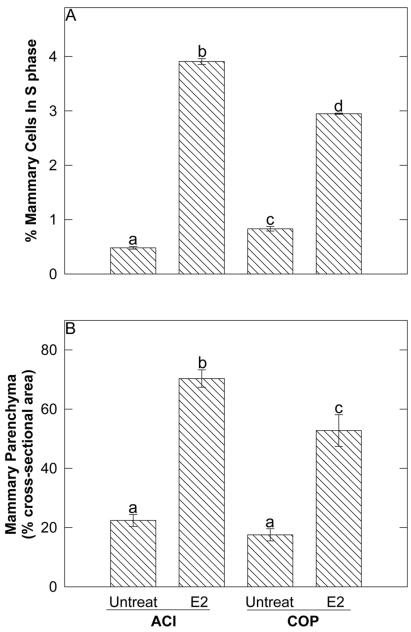
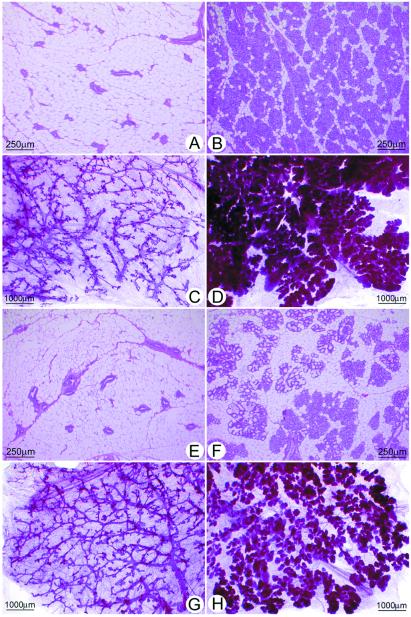
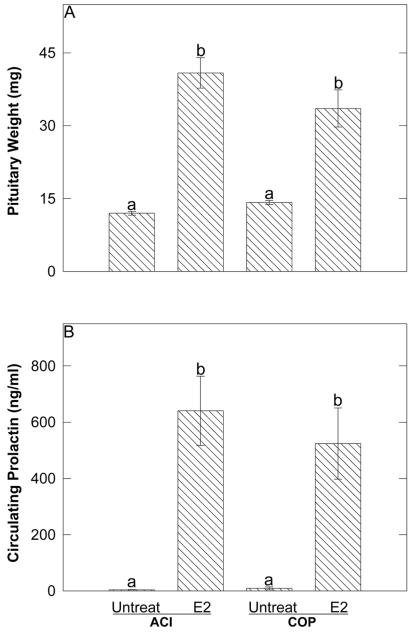
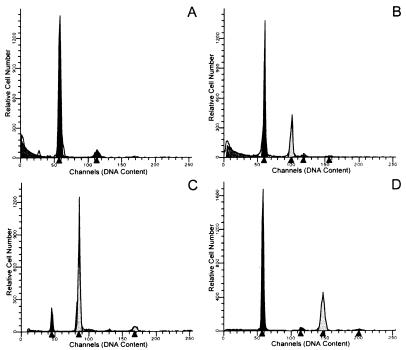
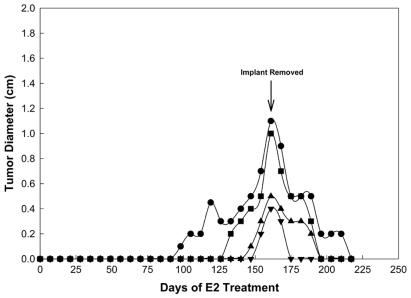
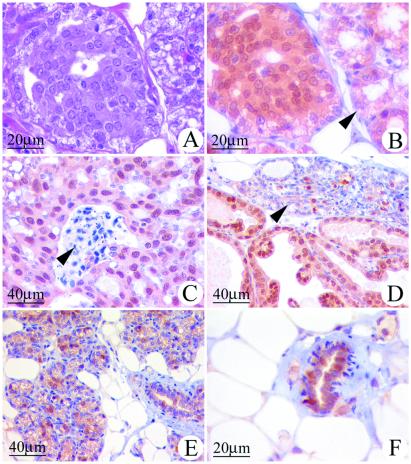
The genetically related ACI and Copenhagen (COP) rat strains display diametrically opposed susceptibilities to mammary cancer development when treated chronically with 17beta-estradiol (E2). Here, we compare the actions of E2 on cell proliferation and lobuloalveolar development in the mammary glands of female ACI and COP rats. After 12 wk of E2 treatment, the mammary glands of ACI rats exhibited a significantly greater proliferative response to E2, compared with COP rats, as evidenced by quantification of S phase fraction and development of lobuloalveolar hyperplasia. Focal regions of atypical epithelial hyperplasia were observed in ACI, but not COP, rats. These strain differences were not because of differences in circulating E2, progesterone or, prolactin. Two-thirds of the induced mammary cancers in ACI rats exhibited aneuploidy. The E2-induced mammary cancers regressed when hormone treatment was discontinued, indicating that they were estrogen-dependent. Progesterone receptor was expressed by the great majority of epithelial cells within the E2-induced atypical hyperplastic foci and the mammary carcinomas, suggesting a link between these lesions. These data demonstrate a correlation between E2 action in the induction of mammary cell proliferation and atypical epithelial hyperplasia and genetically conferred susceptibility to E2-induced mammary cancers.


Figures

Figure 1
Figure 1
The mammary epithelia of ACI and COP rats exhibited differing proliferative responses to E2. Ovary-intact ACI and COP rats were treated with E2 for 12 wk. (A) Mammary cells in S phase were identified by BrdUrd immunohistochemistry. Each data bar represents the mean ± SEM (n = 4–8) number of mammary cells incorporating BrdUrd, expressed as a percent of total mammary cells. Differing lower case letters above data bars indicate statistical significance (p ≤ 0.05) between group means as assessed by ANOVA. (B) The percentage of cross-sectional area comprised by mammary parenchyma was measured by computer-assisted image analysis. Each data bar represents the mean ± SEM (n = 7–8).
Figure 2
Figure 2
The differing proliferative responses of the ACI and COP mammary glands were reflected in mammary histology. (A and E) Thin sections from untreated ACI and COP rats, respectively. (C and G) Whole mounts from these strains. The mammary glands of untreated ACI and COP rats appeared similar and were comprised of branched ducts terminating in alveolar buds. (B and F) Thin sections from E2-treated ACI and COP rats, respectively. (D and H) Whole mounts. Although E2 treatment induced ductal branching and lobuloalveolar hyperplasia in both ACI and COP rats, the response in ACI rats was more pronounced than in COP rats.
Figure 3
Figure 3
E2 induced pituitary growth and hyperprolactinemia similarly in ACI and COP rats. (A) Each data bar represents the mean ± SEM (n = 7–8) pituitary wet weight, which corresponds to pituitary cell number (20). Differing lower case letters above data bars indicate statistical significance (p ≤ 0.05) between group means as assessed by ANOVA. (B) Each data bar represents the mean ± SEM (n = 7–8) level of circulating PRL.
Figure 4
Figure 4
Mammary cancers induced in ACI rats by E2 exhibited aneuploidy. Mammary cancers were induced in ovary-intact ACI rats by prolonged treatment with E2. The horizontal axis represents an arbitrary scale of relative fluorescence intensity, which is directly proportional to DNA content. The vertical axis indicates relative cell number. Cells from the spleen of each tumor-bearing animal were included in parallel samples to provide internal standards for diploid and tetraploid DNA content. (A) Mammary cancer from an ACI rat treated with E2 for 158 days. The majority of cells (≈96%) were diploid. (B) Mammary cancer from an ACI rat treated for 102 days. Approximately 68% of cells were diploid, whereas ≈32% of cells were aneuploid with hyperdiploid DNA content. (C) Mammary cancer from an ACI rat treated for 202 days. Only ≈12% of cells were diploid, whereas ≈88% exhibited a tetraploid DNA content. (D) Mammary cancer from an ACI rat treated for 268 days. The majority of cells (≈65%) were diploid, whereas ≈35% were aneuploid with a hypertetraploid DNA content.
Figure 5
Figure 5
Mammary cancers induced in ACI rats by E2 regressed upon removal of the hormone-containing implant. The four different symbols illustrate the development of four E2-induced mammary cancers in an individual rat and their subsequent regression following removal of the E2-containing implant 158 days after initiation of E2 treatment. Three of the tumors (■, ▴, ▾) regressed completely within 38 days of implant removal, whereas the largest tumor (●) regressed completely within 59 days of cessation of E2 treatment.
Figure 6
Figure 6
Atypical epithelial hyperplasias and mammary cancers induced in ACI rats by E2 express PR. Cells expressing PR were identified immunohistochemically as described in Materials and Methods. (A) Mammary gland, sectioned and stained with hematoxylin and eosin, from a 21-wk-old female ACI rat treated with E2 for 12 wk. Illustrated is a focal region of atypical epithelial hyperplasia and, to the right, adjacent acinar structures. The epithelial cells within the atypical hyperplasia exhibited enlarged nuclei and dense eosinophilic cytoplasmic staining. The illustrated atypical hyperplasia was minimally deviated relative to the surrounding lobules. The number of atypical hyperplastic foci and the degree of cellular atypia were observed to increase as a function of the duration of E2 treatment beyond 12 wk (data not illustrated). (B) A serial section to that in A that has been immunostained for PR. The majority of cells within the atypical epithelial hyperplasia exhibited immunoreactivity to PR, whereas fewer cells in the adjacent acinar structures stained positive for PR (arrow). (C) Mammary comedo carcinoma from an ACI rat treated with E2 for 193 days. The majority of the cancer cells exhibited immunoreactivity to PR. The arrow indicates necrotic debris characteristic of these cancers. (D) Mammary papillary carcinoma from an ACI rat treated with E2 for 216 days. The majority of the epithelial cells within the cancer exhibited immunoreactivity to PR. The arrow indicates adjacent acinar structures where a subset of the epithelial cells were immunoreactive to PR. (E) Mammary gland from an ACI rat treated with E2 for 12 wk exhibited lobuloalveolar hyperplasia. A subset of the epithelial cells stained positive for PR. (F) Mammary gland from an untreated, 21-wk-old, ovary-intact ACI rat; age-matched control for the E2-treated animals illustrated in A, B, and E. A subset of epithelial cells within the normal ductal structures exhibited immunoreactivity to PR.

References

    1. Harris J R, Lippman M E, Veronesi U, Willet W. N Engl J Med. 1992;327:319–328. - PubMed
    1. Pike M C, Spicer D V, Dahmoush L, Press M F. Epidemiol Rev. 1993;15:17–35. - PubMed
    1. Bernstein L, Ross R K. Epidemiol Rev. 1993;15:48–65. - PubMed
    1. Fisher B, Costantino J P, Wickerham D L, Redmond C K, Kavanah M, Cronin W M, Vogel V, Robidoux A, Dimitrov N, Atkins J, et al. J Natl Cancer Inst. 1998;90:1371–1388. - PubMed
    1. Dunning W F, Curtis M R, Segaloff A. Cancer Res. 1947;7:511–521.

Publication types

MeSH terms