. 2000 Feb 29;97(5):2229-34.
doi: 10.1073/pnas.050586197.

Identification of CDK4 as a target of c-MYC

Affiliations

Identification of CDK4 as a target of c-MYC

H Hermeking et al. Proc Natl Acad Sci U S A. .

Abstract

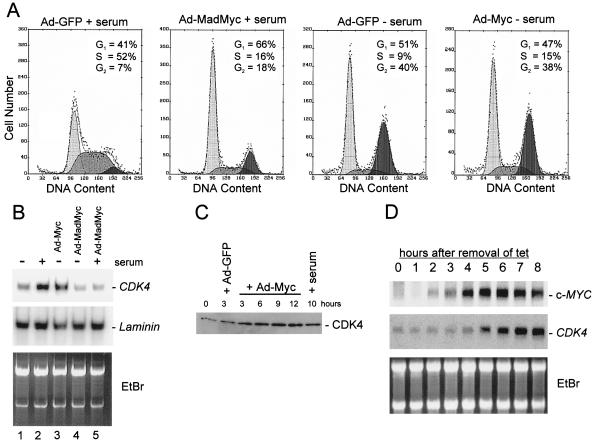
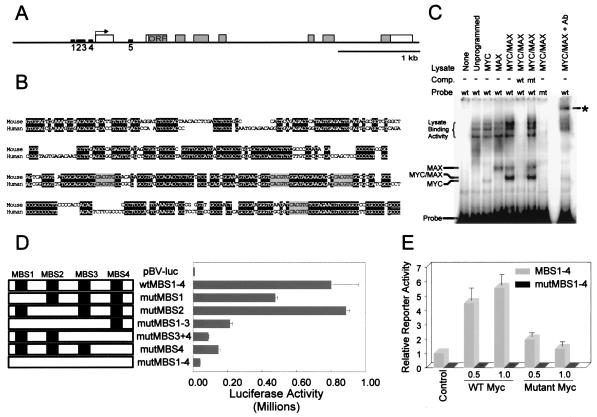
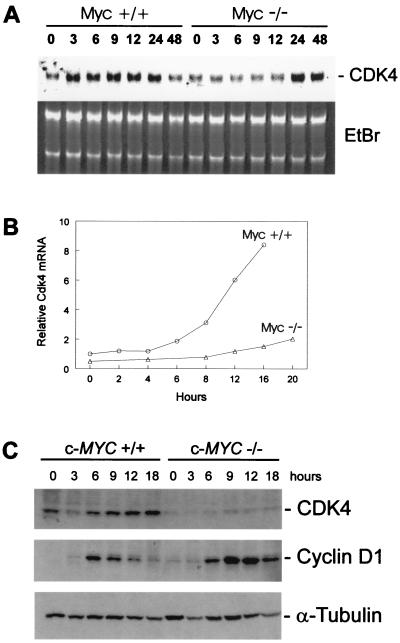
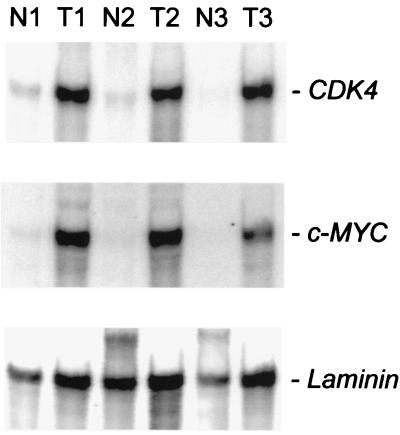
The prototypic oncogene c-MYC encodes a transcription factor that can drive proliferation by promoting cell-cycle reentry. However, the mechanisms through which c-MYC achieves these effects have been unclear. Using serial analysis of gene expression, we have identified the cyclin-dependent kinase 4 (CDK4) gene as a transcriptional target of c-MYC. c-MYC induced a rapid increase in CDK4 mRNA levels through four highly conserved c-MYC binding sites within the CDK4 promoter. Cell-cycle progression is delayed in c-MYC-deficient RAT1 cells, and this delay was associated with a defect in CDK4 induction. Ectopic expression of CDK4 in these cells partially alleviated the growth defect. Thus, CDK4 provides a direct link between the oncogenic effects of c-MYC and cell-cycle regulation.


Figures

Figure 1
Figure 1
Effects of ectopic c-MYC and MADMYC expression on cell-cycle distribution and CDK4 mRNA/protein levels. (A) Flow cytometric analysis of serum-starved HUVEC cells (48 h in 0.5% serum) that were infected with the indicated viruses and maintained in 0.5% serum (− serum) or restimulated by addition of 2% serum (+ serum). Cells were harvested 12 (2 left plots) or 24 h (2 right plots) after viral infection and subjected to flow cytometric analysis as described in ref. . (B) Northern blot analysis with RNA (2.5 μg) from HUVEC cells serum-starved (0.5%) for 24 h and then subjected to the serum stimulation (2%) and/or adenoviral infection as indicated. Membranes were hybridized with a probe for CDK4 or a control probe for laminin mRNA. (C) Western blot analysis of lysates from serum-starved HUVEC cells (48 h in 0.5% serum) infected with Ad-MYC or Ad-GFP, or serum-stimulated and harvested at the indicated times. Membranes were probed with a CDK4-specific antibody (see Materials and Methods). (D) Northern blot analysis with RNA from a human B cell line (P493–6) after activation of a conditional c-MYC allele. P493–6 cells harbor a c-MYC gene under control of a tetracycline-responsive element (24). EtBr, ethidium bromide.
Figure 2
Figure 2
MBS in the CDK4 promoter. (A) Map of the human CDK4 gene indicating the position of E boxes (MBS) in the promoter of the human CDK4 gene (black rectangles, MBS1–5). Gray shading represents the CDK4 ORF. The arrow indicates the transcription start site (TSS). (B) Alignment of the human and mouse CDK4 promoter sequence upstream of the TSS (underlined). Identical residues are shaded black, and the identical MBS are shaded gray. (C) Gel electrophoretic mobility shift assay. Oligonucleotides encompassing the first 200 bp upstream of the TSS depicted in B containing either wild-type (wt) or mutant (mt) MBS were end-labeled with [γ-32P]ATP and incubated with combinations of in vitro-translated MYC and MAX proteins (38). DNA–protein complexes were separated by electrophoresis and detected as “shifts” from the position of the free probe. Addition of an antibody directed against an HA-epitope engineered to the C terminus of MAX was able to generate a “supershifted” band, as indicated by the asterisk. Unlabeled oligonucleotides (40× excess) were used as competitors in some reactions. (D) Luciferase activity of CDK4 promoter constructs was measured in RAT1 cells cotransfected with the indicated reporter and a β-galactosidase-expressing vector as control. Luciferase activity is presented as the average of three separate experiments with SD as error bars. (E) Luciferase activity of indicated CDK4 promoter constructs (MBS1–4 or mutMBS1–4) was measured in NIH 3T3 cells cotransfected with empty vector (Control) or the indicated amounts (in μg) of expression vectors for wild-type c-Myc (WT) or mutant c-Myc (16). Luciferase activity was measured 48 h after transfection and presented as relative activity normalized to the control activity of the wild-type promoter (MBS1–4). Values are the average of four determinations with the SD as error bars.
Figure 3
Figure 3
Requirement of c-Myc for normal induction of Cdk4 after serum stimulation. (A) RAT1 c-Myc +/+(TGR-1) and Rat1 c-Myc −/−(HO15.19) were serum-starved for 48 h in DMEM containing 0.25% calf serum. RAT1 and RAT1 c-Myc −/− were restimulated with 10% calf serum/DMEM, and RNA lysates were prepared at the indicated times. Northern blot analysis was performed with a probe for rat Cdk4 (Upper) and total RNA was stained with ethidium bromide (Lower). (B) RAT1 c-Myc +/+(TGR-1) and Rat1 c-Myc −/−(HO15.19) were serum-starved for 48 h in DMEM containing 0.25% calf serum. RAT1 and RAT1 c-Myc −/− were restimulated with 10% calf serum/DMEM, and RNA lysates were prepared at the indicated times. Northern blot analysis was performed with a probe for rat Cdk4 and glyceraldehyde-3-phosphate dehydrogenase (Gapdh) as an internal control. Relative Cdk4 mRNA levels were determined by quantitating the hybridization signal with a PhosphorImager (Molecular Dynamics), followed by correction for the number of cells loaded by using the internal Gapdh standards. (C) RAT1 c-Myc +/+(TGR-1) and Rat1 c-Myc −/−(HO15.19) were serum-stimulated as described in A, and protein lysates were prepared at the indicated times. Western blot analyses were performed with antibodies against CDK4, cyclin D1, and α-tubulin.
Figure 4
Figure 4
Growth enhancement of c-Myc-deficient cells by ectopic CDK4 expression. (A) Western blot analysis of CDK4 expression in c-Myc-deficient RAT1 cell infected with a CDK4-encoding retrovirus and a gene conferring hygromycin resistance. CDK4-P1, -P2, and -P3 represent pools of hygromycin-resistant c-Myc −/− cells. CDK4, endogenous CDK4. (B) The pools from A were analyzed for growth rates. Cells were seeded in DMEM containing 10% calf serum and counted at 24-h intervals. Each time point represents the average of two independent experiments. β-Gal, β-galactosidase.
Figure 5
Figure 5
Correlation between c-MYC and CDK4 mRNA in colorectal tumors. Northern blot analysis with RNA isolated from normal colonic epithelial cells and tumor cells derived from three different patients is shown.

References

    1. Amati B, Alevizopoulos K, Vlach J. Front Biosci. 1998;3:250–268. - PubMed
    1. Dang C V. Mol Cell Biol. 1999;19:1–11. - PMC - PubMed
    1. Eick D, Hermeking H. Trends Genet. 1996;12:4–6. - PubMed
    1. Garte S. Crit Rev Oncog. 1993;4:435–449. - PubMed
    1. Eilers M, Schirm S, Bishop J M. EMBO J. 1991;10:133–141. - PMC - PubMed

Publication types

Associated data

LinkOut - more resources