. 2000 Feb;99(2):170-8.
doi: 10.1046/j.1365-2567.2000.00964.x.

CpG-oligodeoxynucleotides enhance T-cell receptor-triggered interferon-gamma production and up-regulation of CD69 via induction of antigen-presenting cell-derived interferon type I and interleukin-12

Affiliations

CpG-oligodeoxynucleotides enhance T-cell receptor-triggered interferon-gamma production and up-regulation of CD69 via induction of antigen-presenting cell-derived interferon type I and interleukin-12

K Kranzer et al. Immunology. 2000 Feb.

Abstract

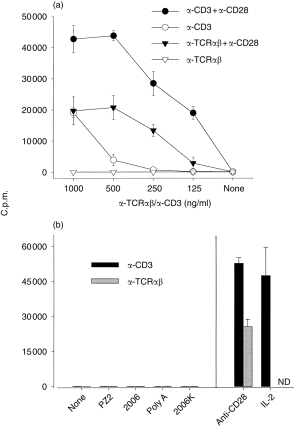
Bacterial cytidine-phosphate-guanosine (CpG-DNA) activates antigen-presenting cells (APC) and drives T helper 1 (Th1)-polarized immune responses in the mouse. Claims have been made that CpG-DNA costimulates murine T cells. We examined the direct and indirect effects of CpG-oligodeoxynucleotides (CpG-ODN) on human T-cell activation. CpG-ODN failed to costimulate purified human T cells activated with alpha-CD3 or alpha-T-cell receptor (TCR)alphabeta antibodies. In contrast, CpG-ODN sequence-specifically caused increased expression of CD69 on CD4 and CD8 T cells when peripheral blood mononuclear cells (PBMC) were stimulated via alpha-CD3. CpG-ODN and alpha-CD3 stimulation synergized to induce interferon-gamma (IFN-gamma) in T cells and natural killer (NK) cells, as shown by intracellular fluorescence-activated cell sorter (FACS) staining. These effects of CpG-ODN on human T cells were caused by the release of IFN type I (IFN-I) and interleukin-12 (IL-12) from PBMC. Enhancement of CD69 expression on alpha-CD3-triggered T cells could be reproduced in a coculture transwell system of purified T cells and PBMC, was inhibited by neutralizing antibodies to IFN-I and could be mimicked by adding exogenous IFN-I. Furthermore, neutralization of either IFN-I or IL-12 diminished, and in combination abolished, IFN-gamma production. These findings show that CpG-ODN potentiate TCR-triggered activation of human T cells in an APC-dependent manner.


Figures

Figure 8
Figure 8
CpG-oligodeoxynucleotide (ODN)-induced type-I interferon (IFN-I) and interleukin (IL)-12 mediate the increase in IFN-γ production from peripheral blood mononuclear cells (PBMC). (a) PBMC were stimulated and the supernatants assayed for IFN-γ, as described in Figure 3, except that neutralizing antibodies to IFN-α/β and IL-12, as well as the recombinant cytokines (for concentrations see Figure 6, recombinant (r)IL-12: 2 ng/ml), were added where indicated. The mean + SEM values from four experiments are shown. (b) Intracellular IFN-γ staining on T cells (fluorescein isothiocyanate [FITC]-positive, stained with α-CD4 and α-CD8) and non-T cells (FITC-negative). Numbers indicate the percentages of IFN-γ+ T cells and non-T cells, respectively. The results of a representative experiment are shown. (c) Supernatants from PBMC treated with CpG-ODN 2006 alone or in combination with soluble α-CD3 up-regulate mRNA levels for IFN-γ in T-cell blasts. Supernatants of PBMC were harvested after 20 hr of culture and transferred to T-cell blasts (2 × 10⁶ in 1 ml). Four hours later, total RNA from T-cell blasts was prepared and analysed by using semiquantitative TaqMan reverse transcription–polymerase chain reaction (RT–PCR). Mean and SD values are shown from duplicate determinations of a representative experiment out of three.
Figure 7
Figure 7
Enhancement of CD69 up-regulation on purified, α-CD3-triggered human T cells by CpG-oligodeoxynucleotide (ODN)-induced soluble factors. T cells (106) were stimulated in 24-well plates coated with 0·8 µg/ml of α-CD3 antibody. ODN were added, where indicated, at a concentration of 2 µ m. In 50% of the samples, 3 × 10⁶ peripheral blood mononuclear cells (PBMC) were placed onto a set-in membrane (designated TRANSWELL), while the other wells contained only T cells. After 24 hr, T cells were harvested and stained with fluorescein isothiocyanate (FITC)-labelled anti-CD69 combined with phycoerythrin (PE)-labelled monoclonal antibodies (mAbs) to either CD4 (hatched bars) or CD8 (black bars).
Figure 1
Figure 1
Failure of various oligodeoxynucleotides (ODN) to costimulate purified human T cells. After negative selection of human T cells, 2 × 10⁴ cells were cultured in quadruplicate in 96-well plates coated, as indicated, with monoclonal antibodies (mAbs) to CD3, T-cell receptor (TCR)αβ or CD28. [3H]Thymidine incorporation was determined on day 4 of culture and is expressed as counts per minute (c.p.m.). Data shown represent mean ± SD from representative experiments. (a) Titration of antibodies to CD3 and TCRαβ. (b) The indicated ODN were added at a concentration of 1·25 µ m to wells coated with either α-CD3 (0·2 µg/ml) (black bars) or α-TCRαβ (1 µg/ml) (grey bars). ND, not done.
Figure 2
Figure 2
Expression of CD69 and CD25 on T cells, B cells and natural killer (NK) cells. Peripheral blood mononuclear cells (PBMC) (5 × 10⁶) were incubated in 24-well plates with the indicated amounts of soluble α-CD3 monoclonal antibodies (mAbs) in the presence or absence of CpG-oligodeoxynucleotides (ODN) 2006 or the non-CpG-ODN AP1 or 2006K. After 24 hr, cells were harvested and stained with fluorescence-labelled antibodies to lineage markers and CD69 or CD25. (a) CD69 expression on T cells (upper panel, fluorescein isothiocyanate [FITC]-labelled antibodies to CD4 and CD8 were combined to gate on T cells) or B cells (lower panel, gated on CD19 FITC-positive cells). Numbers in the upper right corner of histograms show percentages of gated cells lying in the indicated gate on days 1 and 2 of culture. NS, not stimulated. (b) Mean and SEM values of CD69 expression from independent experiments for T cells (CD4 and CD8 stained separately), B cells (CD19+ cells) and natural killer (NK) cells (CD16+ CD56+ cells). Number of experiments carried out: seven for CD4+, five for CD8+, four for CD19+ and three for CD16+ CD56+. (c) Mean and SEM values of CD25 expression on CD4 and CD8 T cells (n = 3).
Figure 3
Figure 3
CpG-oligodeoxynucleotides (ODN) 2006 and α-CD3 synergize to induce interferon-γ (IFN-γ) production from peripheral blood mononuclear cells (PBMC). PBMC (5 × 10⁶) were stimulated overnight either with ODN 2006 or AP1 (both at 2 µ m) or with α-CD3 (10 ng/ml or 100 ng/ml) or with the indicated combinations. Supernatants were analysed by using enzyme-linked immunosorbent assay (ELISA) (detection limit 40–80 pg/ml). Mean + SEM values are shown from seven experiments (using cells from six different donors).
Figure 4
Figure 4
Detection of intracellular interferon-γ (IFN-γ) after stimulation of peripheral blood mononuclear cells (PBMC) with α-CD3 and CpG-oligodeoxynucleotides (ODN). PBMC were stimulated as described in the Material and methods, and Brefeldin A was added 8 hr after onset of culture. After an additional 12 hr of incubation, cells were harvested and double stained for surface lineage markers and intracellular IFN-γ, as outlined in the Materials and methods. (a) A representative experiment showing IFN-γ-producing cells in T cells (fluorescein isothiocyanate [FITC])-positive CD8+ cells have a higher intensity than CD4+ cells) or non-T cells (FITC-negative). Numbers indicate the percentage of IFN-γ+ cells within T cells and non-T cells (FITC-positive and FITC-negative, respectively). (b) Mean and SEM of IFN-γ-producing CD4+ and CD8+ T cells and non-T cells from four (CD4+ and CD8+) and two (non-T cells) experiments.
Figure 5
Figure 5
CpG-oligodeoxynucleotide (ODN) 2006 induces production of type-I interferon (IFN-I) from peripheral blood mononuclear cells (PBMC). Supernatants of PBMC, stimulated as indicated for 24 hr, were analysed by using an enzyme-linked immunosorbent assay (ELISA) for the presence of IFN-α. ND, not detectable.
Figure 6
Figure 6
Blockade of type-I interferon (IFN-I) inhibits the enhancement of CD69 up-regulation by CpG-oligodeoxynucleotide (ODN) 2006. Peripheral blood mononuclear cells (PBMC) were stimulated and analysed as described in Figure 2, except that neutralizing antibodies to human IFN-α and IFN-β (500 U/ml of each) and interleukin (IL)-12 (2 µg/ml) were added to the cultures together with the respective stimuli. Recombinant human IFN-α was added at a concentration of 5000 U/ml. Shown are mean and SEM of CD69 expression on CD4+ and CD8+ cells (from six and five experiments, respectively).

References

    1. Krieg AM, Yi AK, Matson S, et al. CpG motifs in bacterial DNA trigger direct B-cell activation. Nature. 1995;374:546. - PubMed
    1. Yi AK, Krieg AM. Rapid induction of mitogen-activated protein kinases by immune stimulatory CpG DNA. J Immunol. 1998;161:4493. - PubMed
    1. Hacker H, Mischak H, Miethke T, et al. CpG-DNA-specific activation of antigen-presenting cells requires stress kinase activity and is preceded by non-specific endocytosis and endosomal maturation. EMBO J. 1998;17:6230. - PMC - PubMed
    1. Stacey KJ, Sweet MJ, Hume DA. Macrophages ingest and are activated by bacterial DNA. J Immunol. 1996;157:2116. - PubMed
    1. Lipford GB, Sparwasser T, Bauer M, et al. Immunostimulatory DNA: sequence-dependent production of potentially harmful or useful cytokines. Eur J Immunol. 1997;27:3420. - PubMed

Publication types

MeSH terms