. 2000 Jan;129(2):257-64.
doi: 10.1038/sj.bjp.0703037.

Mechanisms of AVP-induced glucagon release in clonal alpha-cells in-R1-G9: involvement of Ca(2+)-dependent and -independent pathways

Affiliations

Mechanisms of AVP-induced glucagon release in clonal alpha-cells in-R1-G9: involvement of Ca(2+)-dependent and -independent pathways

S Yibchok-Anun et al. Br J Pharmacol. 2000 Jan.

Abstract

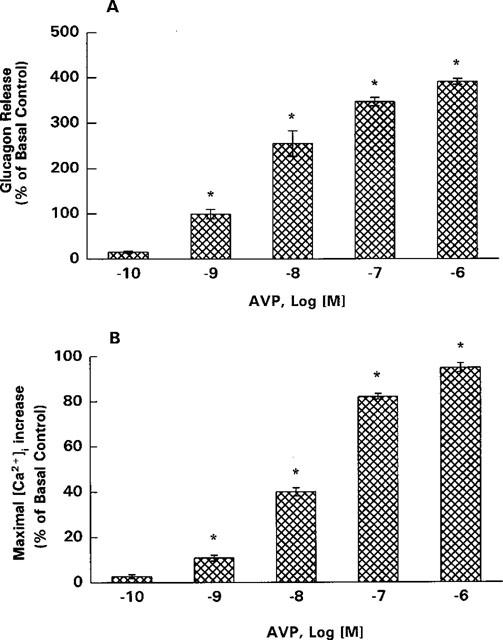
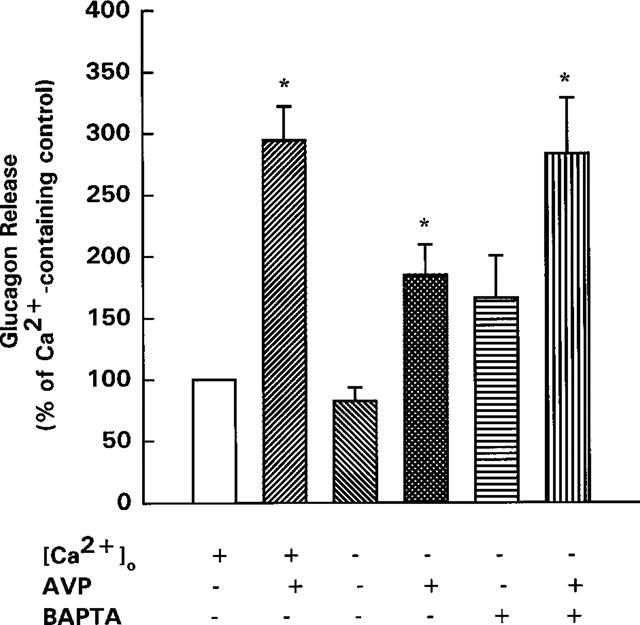
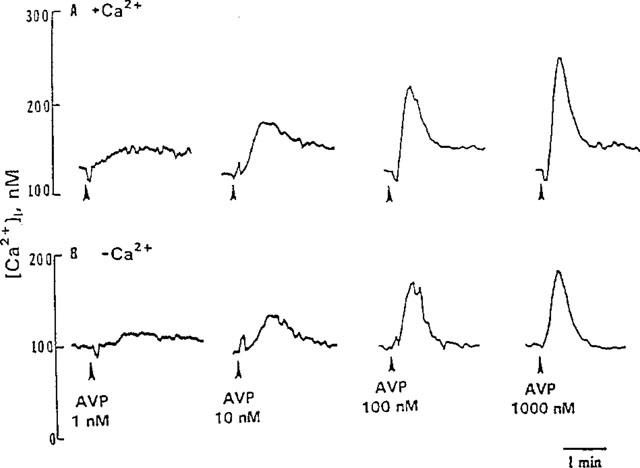
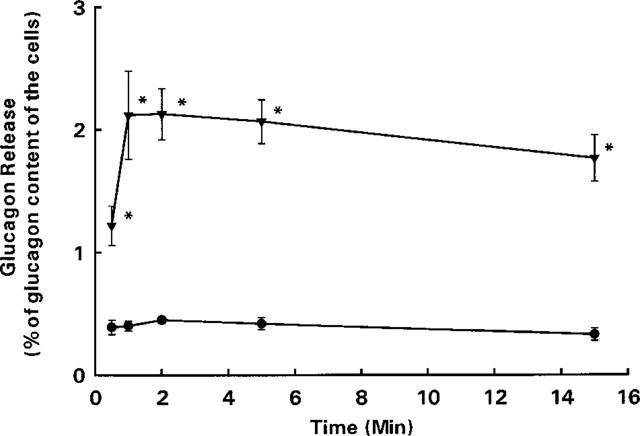
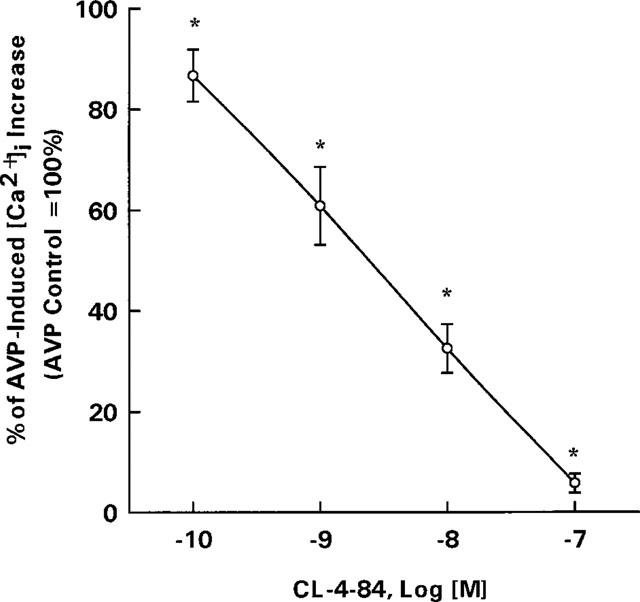
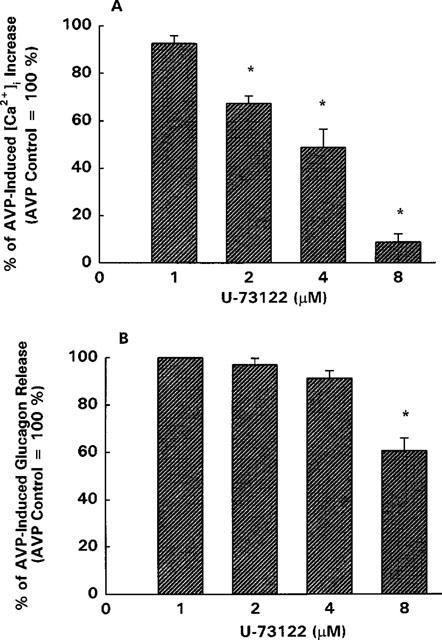
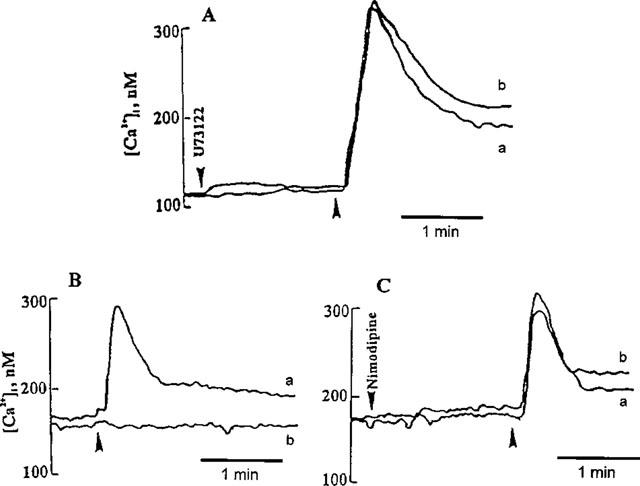
1. The mechanisms underlying AVP-induced increase in [Ca(2+)](i) and glucagon release in clonal alpha-cells In-R1-G9 were investigated. 2. AVP increased [Ca(2+)](i) and glucagon release in a concentration-dependent manner. After the administration of AVP, glucagon was released within 30 s, quickly reached the maximum within 2 min, and maintained a steady-state concentration for at least 15 min. 3. In Ca(2+)-containing medium, AVP increased [Ca(2+)](i) in a biphasic pattern; a peak followed by a sustained plateau. In Ca(2+)-free medium, the Ca(2+) response to AVP became monophasic with lower amplitude and no plateau. Both the basal and AVP-induced glucagon releases were lower in the absence than in the presence of extracellular Ca(2+). When [Ca(2+)](i) was stringently deprived by BAPTA, a Ca(2+) chelator, AVP still significantly increased glucagon release. 4. Pretreatment with thapsigargin, a microsomal Ca(2+) ATPase inhibitor, abolished both the Ca(2+) peak and sustained plateau. 5.AVP increased intracellular concentration of IP(3). 6. U-73122 (8 microM), a phospholipase C inhibitor, abolished AVP-induced increases in [Ca(2+)](i), but only reduced AVP-induced glucagon release by 39%. 7. Pretreatment with nimodipine, an L-type Ca(2+) channel blocker failed to alter AVP-induced glucagon release or increase in [Ca(2+)](i). 8. The results suggest that AVP causes glucagon release through both Ca(2+)-dependent and -independent pathways. For the Ca(2+)-dependent pathway, the G(q) protein activates phospholipase C, which catalyzes the formation of IP(3). IP(3) induces Ca(2+) release from the endoplasmic reticulum, which, in turn, triggers Ca(2+) influx. Both Ca(2+) release and Ca(2+) influx may contribute to AVP-induced glucagon release.


Figures

Figure 1
Figure 1
Effects of AVP on glucagon release (A) and [Ca2+]i increase (B) in In-R1-G9 cells. In (A) static incubation was performed for 15 min to determine glucagon release. The concentration of glucagon release in the basal control group was 235±17 pg  105 cells−1; cell passages 25–29. In (B), the basal [Ca2+]i was 97±4 nM. Values are mean±s.e.mean (n=4). Values are mean±s.e.mean (n=3 cultures with quadruplicates). *P<0.05, compared with the control group.
Figure 2
Figure 2
Effects of AVP (100 nM) on glucagon release in Ca2+-containing, Ca2+-free media and 50 μM BAPTA-AM in Ca2+-free media. BAPTA-AM in Ca2+-free media was given 30 min before the administration of AVP. Static incubation was performed for 15 min to determine the glucagon release. The concentration of glucagon release in the Ca2+-containing control was 144±17 pg  105 cells−1. Values are mean±s.e.mean (n=6 cultures with quadruplicates). *P<0.05, compared with the basal control group at the [Ca2+]i of 2.5 mM. The results of this experiment were obtained from the cells of passage 23–26.
Figure 3
Figure 3
Effects of AVP on [Ca2+]i in Ca2+-containing (A) and Ca2+-free (B) media. Data shown are representative of four experiments.
Figure 4
Figure 4
Time course of glucagon release from In-R1-G9 cells in response to AVP (100 nM). Values are mean±s.e.mean (n=4 cultures with quadruplicates). Mean glucagon content of the cells; basal=25±1.6 ng 105 cells−1, AVP=27±2.8 ng 105 cells−1. • Basal control; ▾ AVP 100 nM. *P<0.05, compared with the basal control group. The results of this experiment were obtained from the cells of passage 23–26.
Figure 5
Figure 5
Effects of CL-4-84 on AVP (100 nM)-induced maximal increase in [Ca2+]i. CL-4-84 was given 100 s before the administration of AVP. Values are mean±s.e.mean (n=4). *P<0.05, compared with the AVP control group, which had a maximal [Ca2+]i increase of 188±11 nM.
Figure 6
Figure 6
Effects of U-73122 on AVP-induced maximal [Ca2+]i increase (A) and glucagon release (B) in In-R1-G9 cells. U-73122 was given 100 s before AVP (100 nM). Values are mean±s.e.mean (n=4 for [Ca2+]i experiments and n=3 cultures with quadruplicates for secretion). *P<0.05, compared with AVP (100 nM) alone as the control group.
Figure 7
Figure 7
Effects of AVP and ionomycin on [Ca2+]i increase in In-R1-G9 cells. (A) Effects of U-73122 on ionomycin-induced [Ca2+]i increase. Curve a shows data of ionomycin (300 nM) alone as a control; curve b shows the effect of U-73122 (8 μM) pretreatment for 100 s before ionomycin administration. (B) Effect of TG on AVP-induced [Ca2+]i increase. Curve a shows data of AVP (100 nM) alone as a control; curve b shows the effect of TG pretreatment (1 μM) for 30 min before AVP administration. (C) Nimodipine did not affect AVP-induced [Ca2+]i increase. Curve a shows data of AVP (100 nM) alone as a control; curve b shows the effect of nimodipine pretreatment (1 μM) for 100 s before AVP administration. Arrow indicates AVP or ionomycin administration. Data shown are representative of four experiments.

Similar articles

Cited by

References

    1. BLEASDALE J.E., FISHER S.K. Use of U-73122 as an inhibitor of phospholipase C-dependent processes. Neuroprotocols. 1993;3:125–133.
    1. BLEASDALE J.E., THAKUR N.R., GREMBAN R.S., BUNDY G.L., FITZPATRICK F.A., SMITH R.J., BUNTING S. Selective inhibition of receptor-coupled phospholipase C-dependent processes in human platelets and polymorphonuclear neutrophils. J. Pharmacol. Exp. Ther. 1990;225:756–768. - PubMed
    1. BODE H.P., YULE D.I., FEHMANN H.C., GOKE B., WILLIAMS J.A. Spontaneous calcium oscillations in clonal endocrine pancreatic glucagon-secreting cells. Biochem. Biophys. Res. Commun. 1994;205:435–440. - PubMed
    1. CHAUDHRY A., RUBIN R.P. Mediators of Ca2+-dependent secretion. Mediators of Ca2+-dependent secretion. Environ. Health Perspect. 1990;84:35–39. - PMC - PubMed
    1. CHEN T.H., LEE B., HSU W.H. Arginine vasopressin-stimulated insulin secretion and elevation of intracellular Ca++ concentration in rat insulinoma cells: Influences of a phospholipase C inhibitor 1-[6-[[17β-methoxyestra-1,3,5(10)-trien-17-yl]amino]hexyl]-1H-pyrrole-2,5-dione (U-73122) and a phospholipase A2 inhibitor N-(p-Amylcinnamoyl)anthranilic acid. J. Pharmacol. Exp. Ther. 1994;270:900–904. - PubMed

Publication types

MeSH terms

LinkOut - more resources