. 2000 Mar;115(3):277-86.
doi: 10.1085/jgp.115.3.277.

Modulation of N-type calcium channel activity by G-proteins and protein kinase C

Affiliations

Modulation of N-type calcium channel activity by G-proteins and protein kinase C

C F Barrett et al. J Gen Physiol. 2000 Mar.

Abstract

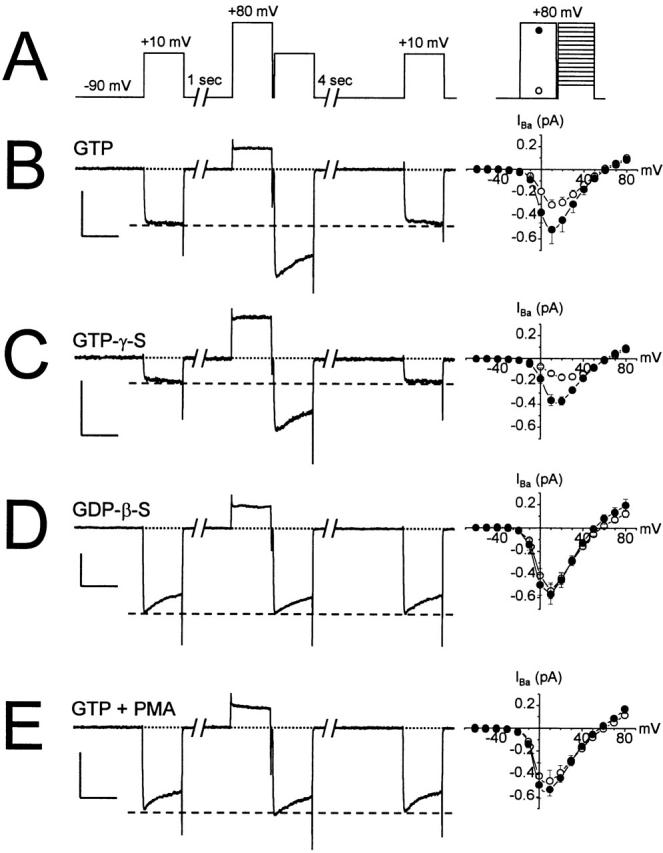
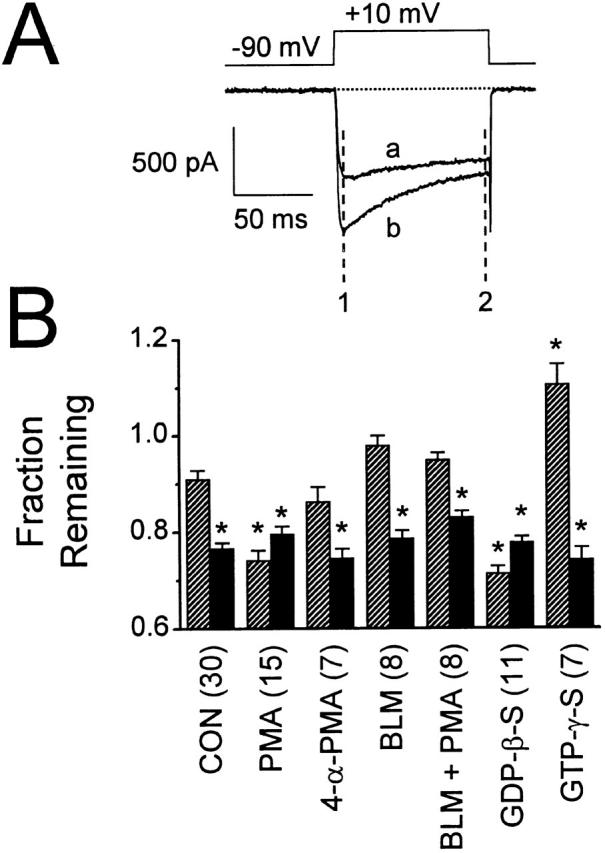
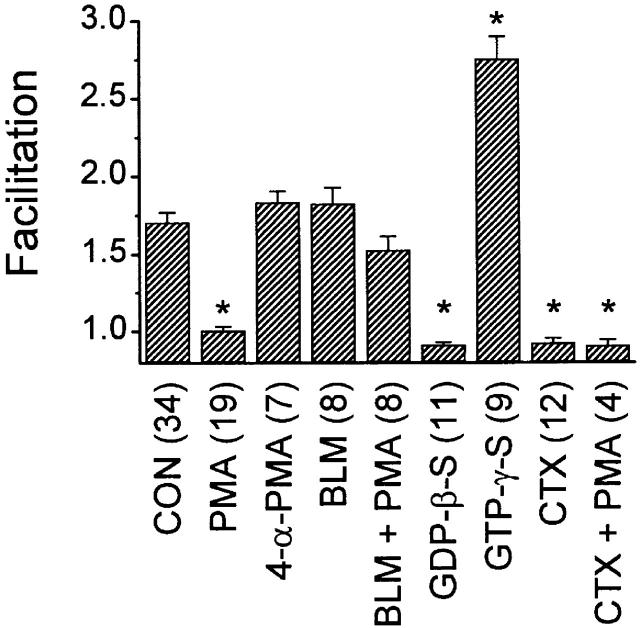
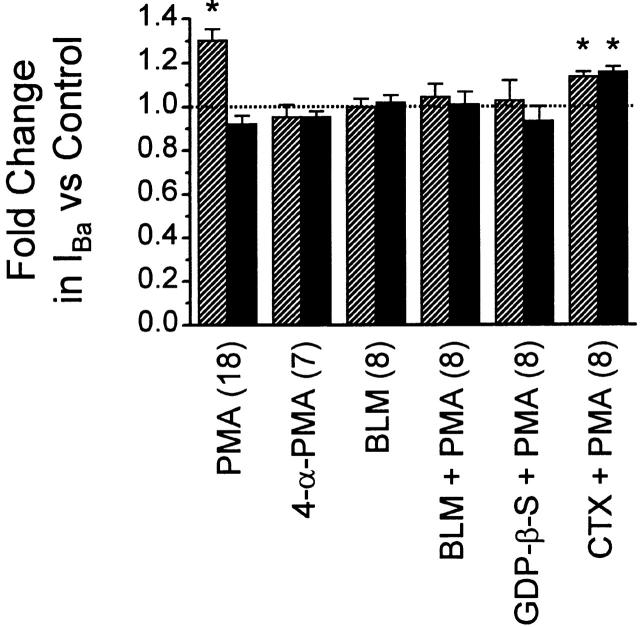
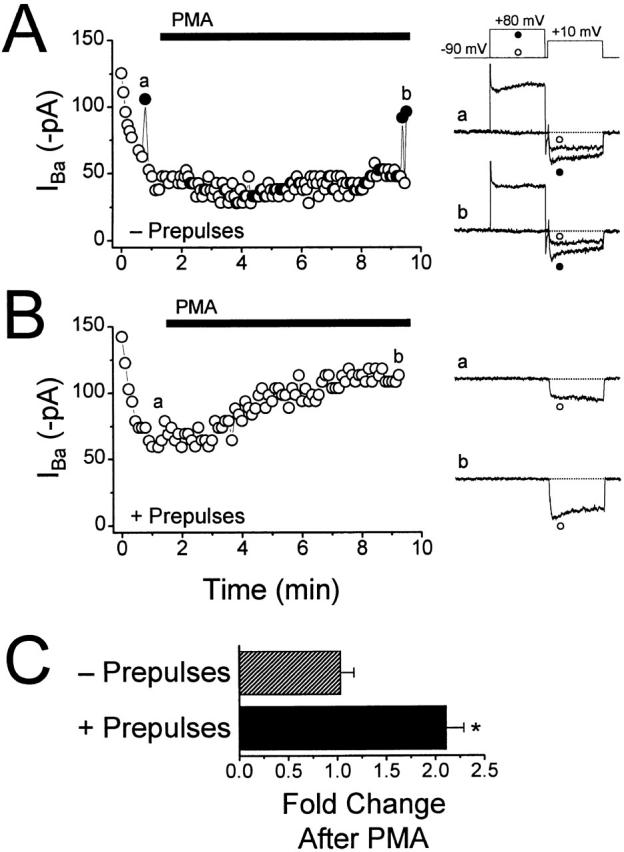
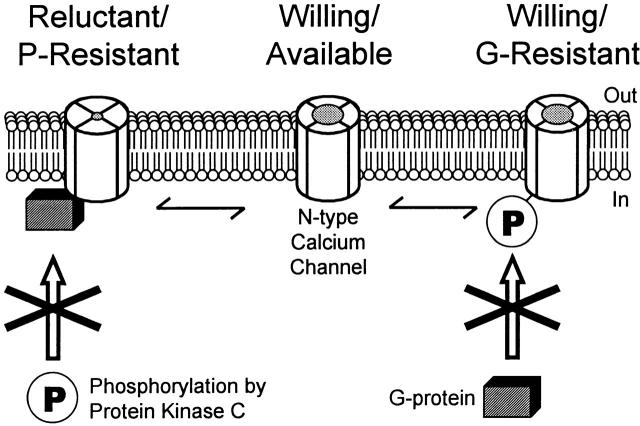
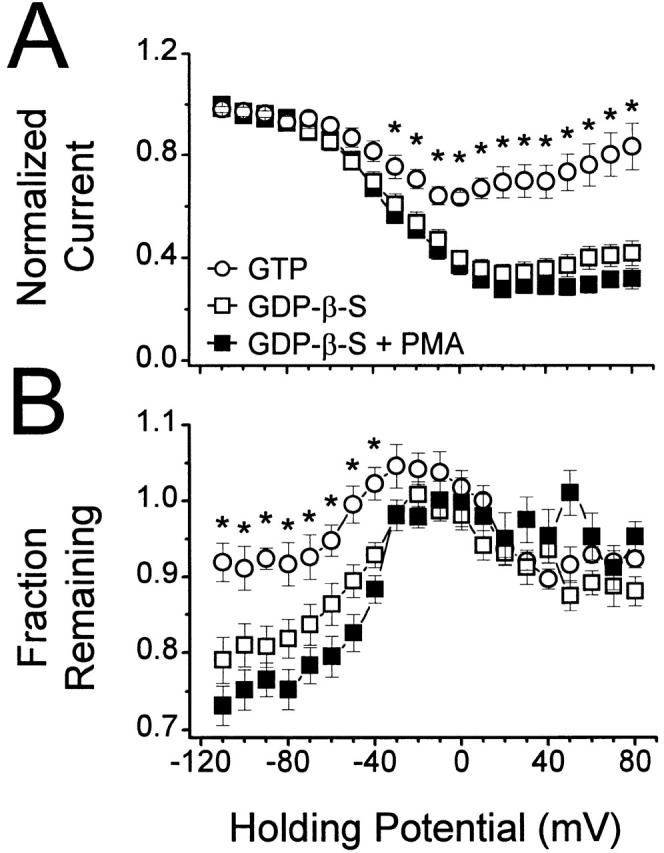
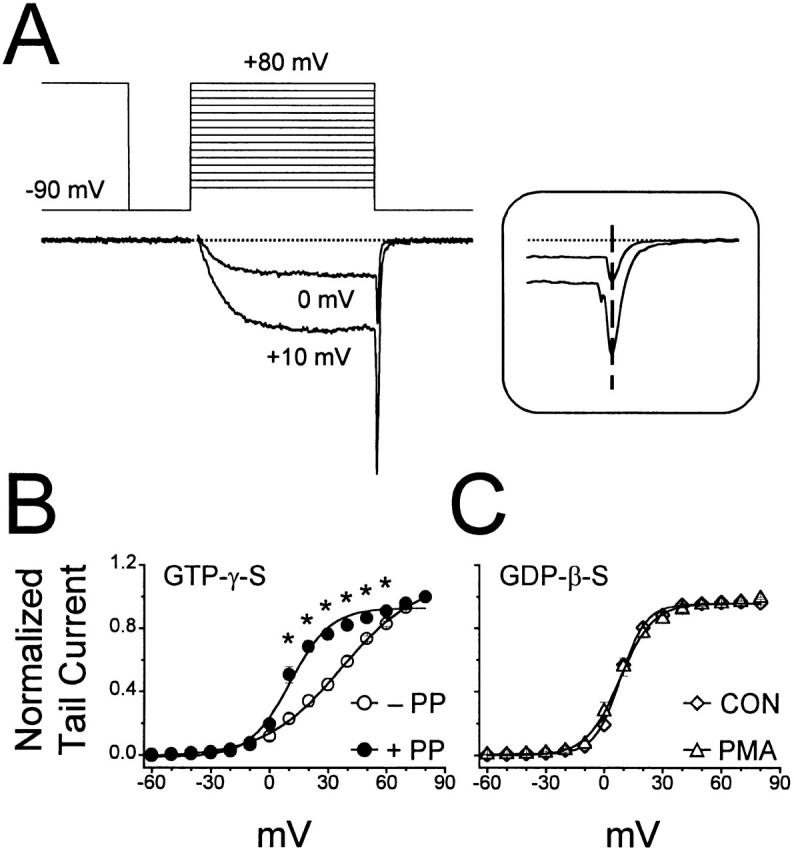
N-type voltage-gated calcium channel activity in rat superior cervical ganglion neurons is modulated by a variety of pathways. Activation of heterotrimeric G-proteins reduces whole-cell current amplitude, whereas phosphorylation by protein kinase C leads to an increase in current amplitude. It has been proposed that these two distinct pathways converge on the channel's pore-forming alpha(1B) subunit, such that the actions of one pathway can preclude those of the other. In this study, we have characterized further the actions of PKC on whole-cell barium currents in neonatal rat superior cervical ganglion neurons. We first examined whether the effects of G-protein-mediated inhibition and phosphorylation by PKC are mutually exclusive. G-proteins were activated by including 0.4 mM GTP or 0.1 mM GTP-gamma-S in the pipette, and PKC was activated by bath application of 500 nM phorbol 12-myristate 13-acetate (PMA). We found that activated PKC was unable to reverse GTP-gamma-S-induced inhibition unless prepulses were applied, indicating that reversal of inhibition by phosphorylation appears to occur only after dissociation of the G-protein from the channel. Once inhibition was relieved, activation of PKC was sufficient to prevent reinhibition of current by G-proteins, indicating that under phosphorylating conditions, channels are resistant to G-protein-mediated modulation. We then examined what effect, if any, phosphorylation by PKC has on N-type barium currents beyond antagonizing G-protein-mediated inhibition. We found that, although G-protein activation significantly affected peak current amplitude, fast inactivation, holding-potential-dependent inactivation, and voltage-dependent activation, when G-protein activation was minimized by dialysis of the cytoplasm with 0.1 mM GDP-beta-S, these parameters were not affected by bath application of PMA. These results indicate that, under our recording conditions, phosphorylation by PKC has no effect on whole-cell N-type currents, other than preventing inhibition by G-proteins.


Figures

Figure 1
Figure 1
Modulation of whole-cell barium currents by G-proteins and PMA. (A) The voltage protocol used to elicit the currents shown in B–E. (Left) Whole-cell sweeps; (right) mean current–voltage plots elicited with (•, n = 7–20) or without (○, n = 6–12) prepulses to +80 mV. In this and subsequent figures, the delay between the prepulse and test pulse is 5 ms, and error bars not visible are contained within the symbols. (B) Whole-cell currents were elicited in control bath solution with GTP in the pipette. (C) GTP-γ-S was substituted for GTP in the pipette solution. (D) GDP-β-S was substituted for GTP in the pipette. (E) The same cell shown in B, 2 min after bath application of 500 nM PMA. For all sweeps, the horizontal calibration bars are 100 ms, and the vertical calibration bars are 500 pA.
Figure 3
Figure 3
Prepulses and PMA both increase voltage-dependent fast inactivation. (A) Fast inactivation was measured as the fraction of the initial inward current (1) that remains at the end of a 100-ms test pulse (2). (a) Control current elicited by the voltage command shown; (b) current elicited after bath application of 500 nM PMA. (B) Summary of fraction remaining, as defined in A, for unfacilitated (no prepulse, hatched columns) and facilitated (prepulse to +80 mV, solid columns) whole-cell currents. In control solution, application of a prepulse reduced the fraction remaining from 0.91 ± 0.02 to 0.77 ± 0.01 (n = 30). Bath application of 500 nM PMA (n = 15) led to a reduction in unfacilitated fraction remaining (0.74 ± 0.02), whereas facilitated currents in PMA were not significantly different than facilitated control currents (0.80 ± 0.01). 500 nM 4-α-PMA, 100 nM BLM, and PMA after BLM were all without effect. As with PMA, dialysis with GDP-β-S (n = 11) reduced the unfacilitated fraction remaining (0.71 ± 0.01), but was without effect on facilitated currents (0.78 ± 0.01). In contrast, dialysis with GTP-γ-S (n = 7) greatly increased the unfacilitated fraction remaining (1.11 ± 0.04), but, as with all other treatments, was without effect on facilitated currents (0.74 ± 0.02). *P < 0.05 compared with unfacilitated control.
Figure 2
Figure 2
Summary of facilitation, expressed as the ratio of current amplitude after a prepulse to current amplitude before a prepulse. Control facilitation was 1.71 ± 0.06 (n = 34). Application of 500 nM PMA reduced facilitation to 1.01 ± 0.02 (n = 19). In contrast, 500 nM 4-α-PMA, 100 nM BLM, and PMA after BLM were all without significant effect. Substituting 0.1 mM GDP-β-S for GTP in the pipette solution decreased facilitation to 0.91 ± 0.02 (n = 11), whereas substituting 0.1 mM GTP-γ-S for GTP increased facilitation to 2.76 ± 0.14 (n = 9). After a 10-min incubation with 1 μM CTX, control facilitation was lost (0.92 ± 0.03, n = 12), and subsequent application of PMA was without further effect (0.91 ± 0.04, n = 4). *P < 0.001 compared with control.
Figure 5
Figure 5
The effects of PMA on current amplitude, facilitation, and fast inactivation follow a parallel time course in a single whole-cell recording. (A and C) Open symbols represent currents elicited without a prepulse; closed symbols represent currents elicited after a prepulse to +80 mV. 500 nM PMA was applied to the bath where indicated by the solid bar. (A) Time course of peak inward current. (B) Time course of facilitation, as calculated in Fig. 2. (C) Fraction remaining was calculated as in Fig. 3 and plotted against time.
Figure 4
Figure 4
Summary of fold change in peak inward current amplitude for unfacilitated (no prepulse, hatched columns) and facilitated (prepulse to +80 mV, solid columns) whole-cell currents elicited at +10 mV. 500 nM PMA (n = 18) increased unfacilitated currents by 1.31 ± 0.05-fold, but was without effect on facilitated currents (0.92 ± 0.04-fold). 500 nM 4-α-PMA was without effect, and 100 mM BLM blocked PMA's effects. Application of PMA after dialysis with GDP-β-S (n = 8) was without effect (1.03 ± 0.09-fold for unfacilitated, and 0.94 ± 0.06-fold for facilitated). After a 10-min preincubation in 1 μM CTX (n = 8), PMA caused slight but significant increases in both unfacilitated and facilitated currents (1.14 ± 0.02-fold and 1.16 ± 0.02-fold, respectively). *P < 0.005 compared with control.
Figure 6
Figure 6
G-protein–mediated inhibition blocks PMA's effects on whole-cell currents. (A–B) Currents were elicited by stepping to +10 mV, and peak inward current was plotted against time (left). GTP-γ-S was included in the pipette solution, and 500 nM PMA was applied to the bath as indicated by the solid bars. At the right are individual sweeps from the times indicated. (A) Currents were elicited without applying prepulses, except where indicated by •, which were evoked following a prepulse to +80 mV. (B) In a second experiment, currents were elicited using the voltage protocol shown in A; prepulses were applied every other sweep, and currents evoked without a prepulse are plotted. (C) Summary of the fold change in current amplitude after application of PMA. In the absence of prepulses, PMA caused a 1.04 ± 0.13-fold change in current amplitude (n = 4). In contrast, when alternating test pulses were preceded by prepulses, applying PMA increased current amplitude 2.12 ± 0.17-fold (n = 4). *P < 0.005 compared with those without prepulses.
Figure 9
Figure 9
Phosphorylation by PKC and modulation by G-proteins are mutually exclusive. Unmodulated N-type calcium channels are willing and available for either G-protein modulation or phosphorylation by PKC (Willing/Available). G-protein binding leads to a reluctant channel that is resistant to phosphorylation (Reluctant/P-Resistant). Alternatively, phosphorylation by PKC leads to a willing channel that is resistant to G-protein interactions (Willing/G-Resistant). Note that shifting from P-reluctant to G-reluctant (and vice versa) requires a transition through the willing and available form of the channel.
Figure 7
Figure 7
Activation of PKC does not affect holding potential–dependent inactivation. Currents were elicited by first applying a 2.2-s prepulse of varying voltage, followed 5-ms later by a 100-ms step to +10 mV. ○ were obtained with GTP in the pipette (n = 6), □ were obtained with 0.1 mM GDP-β-S substituted for GTP (n = 7), and ▪ were obtained with 0.1 mM GDP-β-S in the pipette and 500 nM PMA in the bath (n = 6). The symbol key pertains to both A and B. (A) Normalized holding potential–induced inactivation plots were generated by measuring the peak inward current during test pulses to +10 mV from each holding potential, and then dividing by the maximum current obtained. No statistically significant difference exists between the two sets of GDP-β-S data. (B) The fraction of current remaining was calculated as in Fig. 3. No statistically significant difference exists between the two sets of GDP-β-S data. *P < 0.05 versus GDP-β-S and versus GDP-β-S + PMA.
Figure 8
Figure 8
Activation of PKC does not alter the voltage dependence of activation of whole-cell barium currents. (A) Activation plots were generated using a voltage command consisting of 15-ms pulses to incremental test potentials, either with or without a 100-ms prepulse to +80 mV. Shown are two currents elicited, at the voltage indicated, with GDP-β-S in the pipette solution. Fast tail current amplitudes (A, inset) were measured at the dashed line, normalized, and then plotted against test potential (B). Boltzmann fits (see methods) were applied to the data (solid lines), and all curves were fit with a Chi-square value of <0.002. (B) When 0.1 mM GTP-γ-S was included in the pipette solution, the threshold for activation was approximately −20 mV (−PP, ○). Applying prepulses (+PP, •) was without effect on the threshold of activation, but the voltage eliciting half-maximal activation was shifted negative. *P < 0.01 versus no prepulse. (C) When the pipette solution contained 0.1 mM GDP-β-S, unfacilitated control (⋄) and PMA (500 nM, ▵) activation plots were virtually indistinguishable. See Table for values and sample sizes.

Comment in

  • Modulating modulation.
    Bean BP. Bean BP. J Gen Physiol. 2000 Mar;115(3):273-5. doi: 10.1085/jgp.115.3.273. J Gen Physiol. 2000. PMID: 10694256 Free PMC article. Review. No abstract available.

References

    1. Bean B.P. Neurotransmitter inhibition of neuronal calcium currents by changes in channel voltage dependence. Nature. 1989;340:153–156. - PubMed
    1. de Leon M., Wang Y., Jones L., Perez-Reyes E., Wei X., Soong T.W., Snutch T.P., Yue D.T. Essential Ca(2+)-binding motif for Ca(2+)-sensitive inactivation of L-type Ca2+ channels. Science. 1995;270:1502–1506. - PubMed
    1. Dubel S., Starr T., Hell J., Ahlijanian M., Enyeart J., Catterall W., Snutch T. Molecular cloning of the alpha-1 subunit of an omega-conotoxin-sensitive calcium channel. Proc. Natl. Acad. Sci. USA. 1992;89:5058–5062. - PMC - PubMed
    1. Erlich I., Elmslie K.S. Neurotransmitters acting via different G proteins inhibit N-type calcium current by an identical mechanism in rat sympathetic neurons. J. Neurophysiol. 1995;74:2251–2257. - PubMed
    1. Fox A.P., Nowycky M.C., Tsien R.W. Kinetic and pharmacological properties distinguishing three types of calcium currents in chick sensory neurones. J. Physiol. 1987;394:149–172. - PMC - PubMed

Publication types

MeSH terms