. 2000 Feb;21(2):357-66.

Comparison of relative cerebral blood volume and proton spectroscopy in patients with treated gliomas

Affiliations

Comparison of relative cerebral blood volume and proton spectroscopy in patients with treated gliomas

R G Henry et al. AJNR Am J Neuroradiol. 2000 Feb.

Abstract

Background and purpose: Elevated relative regional cerebral blood volume (rCBV) reflects the increased microvascularity that is associated with brain tumors. The purpose of this study was to investigate the potential role of rCBV in the determination of recurrent/residual disease in patients with treated gliomas.

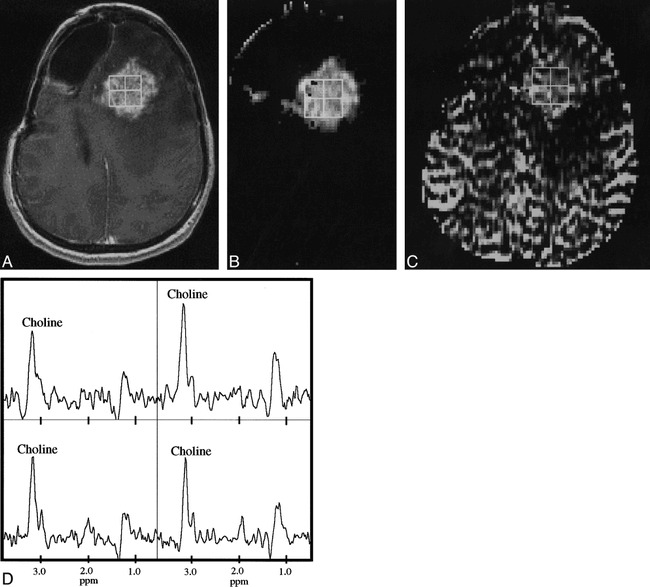
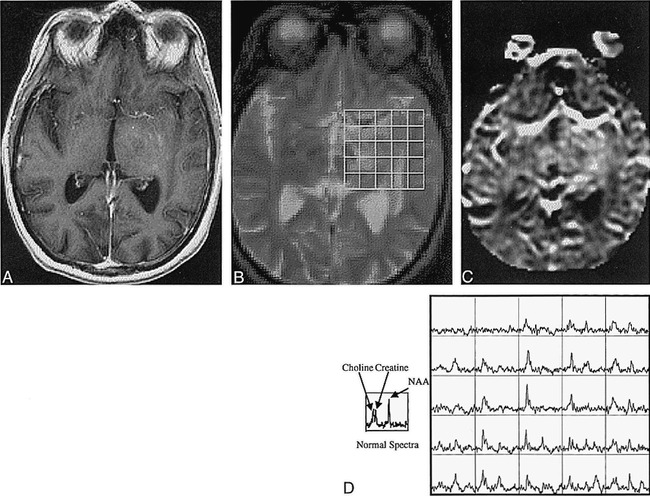
Methods: Thirty-one rCBV studies were performed in 19 patients with treated gliomas. All patients also had proton MR spectroscopy and conventional MR imaging. Regions of abnormality were identified on conventional MR images by two neuroradiologists and compared with rCBV and MR spectroscopic data. Metabolites and rCBV were quantified and compared in abnormal regions.

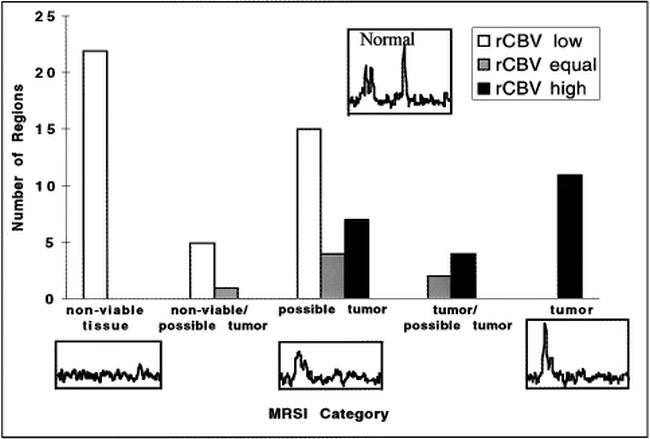
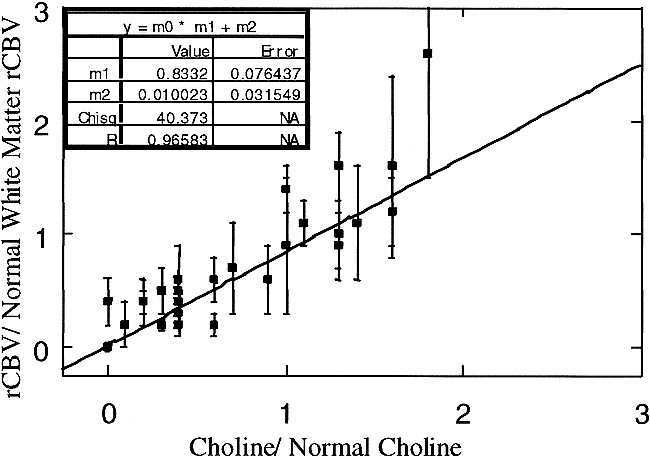
Results: In high-grade tumors, rCBV values were proportional to choline in regions of tumor and nonviable tissue. Although the presence of residual/recurrent disease was often ambiguous on conventional MR images, the rCBV maps indicated regions of elevated vascularity in all low-grade tumors and in 12 of 17 grade IV lesions. Regions of elevated and low rCBV corresponded well with spectra, indicating tumor and nonviable tissue, respectively.

Conclusion: This study suggests that rCBV maps and MR spectroscopy are complementary techniques that may improve the detection of residual/recurrent tumor in patients with treated gliomas. Compared with the spectra, the rCBV maps may better reflect the heterogeneity of the tumor regions because of their higher resolution. The multiple markers of MR spectroscopy enable better discrimination between normal and abnormal tissue than do the rCBV maps.


Figures

<sc>fig</sc> 1.
fig 1.
A, MR signal versus time curves for the empirical model ROI. The signal was taken from an ROI of all nonenhancing pixels from the hemisphere contralateral to the abnormality. B, Time courses for the empirical model of vascular concentration (with error bars) and for the associated tissue concentration. The intravascular concentration model was obtained from the time curve for nonenhancing pixels shown in A. The model of contrast agent concentration in the tissue was calculated from the empirical model of the intravascular concentration.
<sc>fig</sc> 2.
fig 2.
A, The measured signal versus time for a moderately enhancing region of a recurrent anaplastic astrocytoma. Enhancement of the signal after the bolus arrival is due to the leakage of contrast agent into the extravascular space. B, The vascular concentration versus time corrected for the leakage of contrast agent into the tissue for the ROI described in A. The corrected rCBV (shaded area) is twice that of normal white matter.
<sc>fig</sc> 3.
fig 3.
A, The measured signal versus time for a contrast-enhancing region with Cho/normal Cho = 0.4. B, The vascular concentration after correction for leakage (squares) and model fit (smooth line) versus time for the ROI described in A. The calculated rCBV (shaded area) is one fourth the rCBV of normal white matter.
<sc>fig</sc> 4.
fig 4.
A and B, Contrast-enhanced T1-weighted image (32/8/1) (A) and rCBV map (B) for a patient with glioblastoma multiforme. The rCBV is increased in the region coincident with contrast-enhancement on the T1-weighted image and decreased in the nonenhancing region with possible tumor/edema/post-treatment effects. The contrast-enhancing region was resected and the histologic examination indicated recurrent tumor
<sc>fig</sc> 5.
fig 5.
Correlations of MR spectroscopy (MRSI) and rCBV for regions interpreted on the conventional MR images for all gliomas. There was a strong correlation (P < .001) between the rCBV assessed from the maps and their corresponding spectra. In particular, no clear tumor spectral pattern was found in the regions with rCBV below normal. Tumor spectral patterns were found in 15 of 22 regions with elevated rCBV; the remaining seven regions had spectral patterns suggestive of possible tumor. Regions on the rCBV map were determined to be lower than, equal to, or higher than the rCBV of normal-appearing contralateral white matter remote from tumor and outside the treatment port
<sc>fig</sc> 6.
fig 6.
A–D, Contrast-enhanced T1-weighted (32/8/1) image (A) permeability-weighted image (B), rCBV map (C), and corresponding proton spectra (D) for a patient with recurrent anaplastic astrocytoma. Note that the intensity of the rCBV map is markedly lower in the regions of reduced intensity posterior to the contrast-enhanced T1-weighted image, which may correspond to a region of edema or infiltrative nonenhancing tumor. The 2 × 2 array of proton spectra from voxels corresponding to the contrast-enhancing lesion indicate tumor, as evidenced by elevated levels of Cho, negligible NAA, and a resonance corresponding to lactate or lipid
<sc>fig</sc> 7.
fig 7.
A–D, T1-weighted (32/8/1) (A) and T2-weighted (2500/30/1) (B) images resampled to the resolution of the rCBV map (C) and corresponding spectra (D) of a patient with an oligoastrocytoma. Spectra with elevated Cho and decreased NAA coincide with the abnormality on the T2-weighted image. The abnormal regions on the conventional T1- and T2-weighted images were interpreted to be areas of possible tumor, post-treatment changes, and/or edema, whereas the rCBV map was elevated relative to normal white matter and the spectra showed a tumor pattern. Therefore, conventional MR imaging was not specific for the presence of tumor, whereas both the rCBV map and the proton spectra indicated tumor. Note also the difficulty of assessing increased microvascularity near the middle cerebral artery on the rCBV map. This case is typical for low-grade tumors and unusual for most treated higher-grade tumors, because there are regions of hyperintensity on the rCBV map in nonenhancing regions
<sc>fig</sc> 8.
fig 8.
Normalized rCBV versus normalized Cho for low Cho/low NAA spectra and spectra with normal to elevated Cho and reduced NAA

References

    1. Aronen HJ, Cohen MS, Belliveau JW, Fordham JA, Rosen BR. Ultrafast imaging of brain tumors. Top Magn Reson Imaging 1993;5:14-24 - PubMed
    1. Rosen BR, Belliveau JW, Chien D. Perfusion imaging by nuclear magnetic resonance. Magn Reson Q 1989;5:263-281 - PubMed
    1. Maeda M, Itoh S, Kimura H, et al. Tumor vascularity in the brain: evaluation with dynamic susceptibility-contrast MR imaging. Radiology 1993;189:233-238 - PubMed
    1. Guckel F, Brix G, Rempp K, Deimling M, Rother J, Georgi M. Assessment of cerebral blood volume with dynamic susceptibility contrast enhanced gradient-echo imaging. J Comput Assist Tomogr 1994;18:344-351 - PubMed
    1. Aronen HJ, Gazit IE, Louis DN, et al. Cerebral blood volume maps of gliomas: comparison with tumor grade and histologic findings. Radiology 1994;191:41-51 - PubMed

Publication types

MeSH terms