

MR spectroscopy in gliomatosis cerebri
- PMID: 10696026
- PMCID: PMC7975356
MR spectroscopy in gliomatosis cerebri
Abstract
Background and purpose: The diagnosis of gliomatosis cerebri with MR imaging is known to be difficult. We report on the value of MR spectroscopy in the diagnosis, grading, and biopsy planing in eight patients with histopathologically proved gliomatosis cerebri.
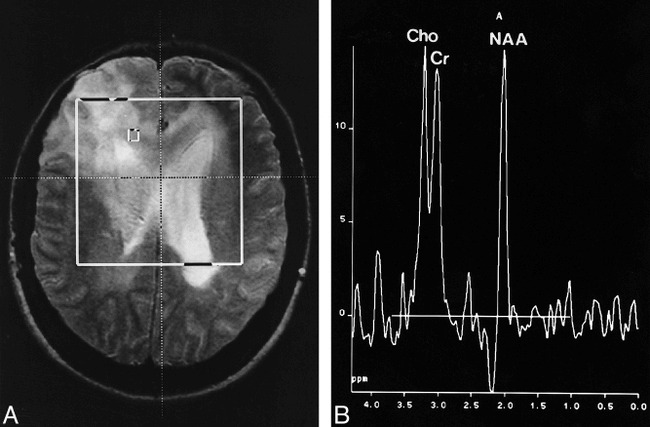
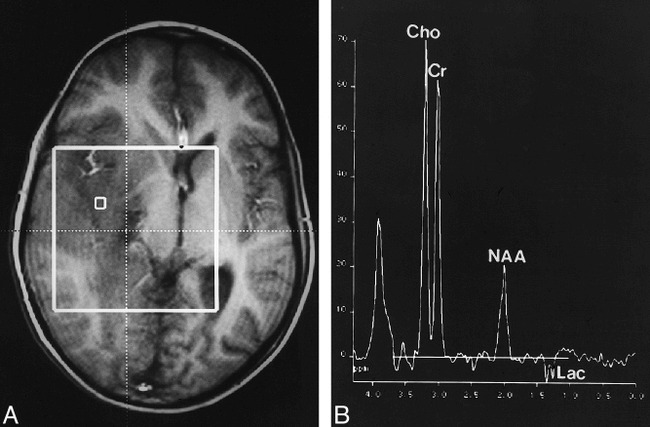
Methods: Patients underwent MR imaging and MR spectroscopy (single-voxel point-resolved spectroscopy [PRESS] at 1500/135, and chemical-shift imaging [CSI] PRESS at 1500/135) before open (n = 4) or stereotactic (n = 4) biopsy. In six patients who underwent CSI, biopsy samples were taken from regions of maximally elevated levels of choline/N-acetylaspartate (Cho/NAA).
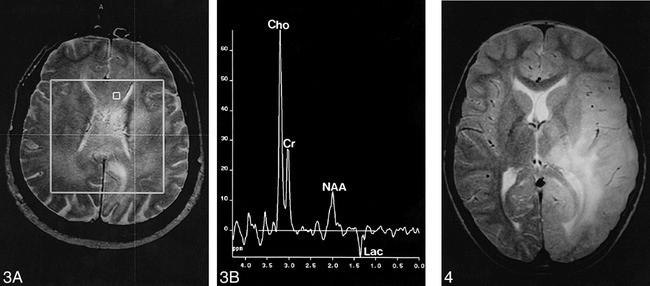
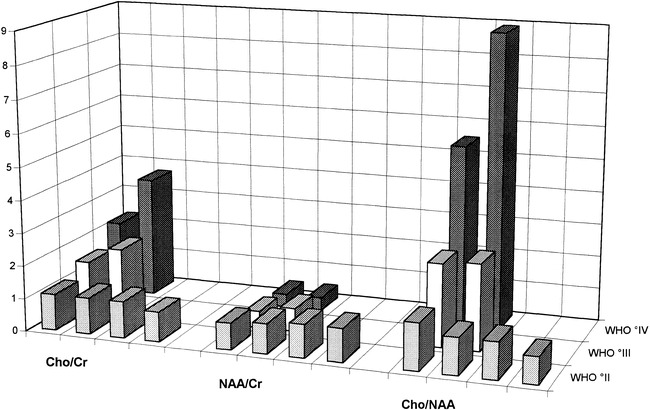
Results: All patients showed elevated Cho/creatine (Cr) and Cho/NAA levels as well as varying degrees of decreased NAA/Cr ratios, which were most pronounced in the anaplastic lesions. In low-grade lesions, there was a maximum Cho/NAA ratio of 1.3, whereas in anaplastic tumors, the maximum Cho/NAA level was at least 2.5. Spectra in two patients with grade III lesions revealed a lactate peak; lactate and lipid signals were seen in two patients with grade IV lesions. Biopsy specimens from regions with maximally elevated levels of Cho/NAA showed dense infiltration of tumor cells.
Conclusion: MR spectroscopy might be used to classify gliomatosis cerebri as a stable or a progressive disease indicating its potential therapeutic relevance.
Figures
References
-
- Kleihues P, Burger PC, Scheithauer PW. The new WHO classification of brain tumors. Brain Pathol 1993;3:255-268 - PubMed
-
- Couch JR, Weiss SA. Gliomatosis cerebri. Neurology 1974;24:504-511 - PubMed
-
- Nevin S. Gliomatosis cerebri. Brain 1938;61:170-191
-
- Carpio-O'Donovan R, Korah I, Salazar A, Melacon D. Gliomatosis cerebri. Radiology 1996;198:831-835 - PubMed
-
- Burger PC, Scheithauer BW. Atlas of Tumor Pathology: Tumors of the Central Nervous System. Washington, DC: Armed Forces Institute of Pathology; 1994: 3rd series, fasc. 10
Publication types
MeSH terms
Substances
LinkOut - more resources
Full Text Sources
Medical