. 2000 Mar 1;19(5):831-42.
doi: 10.1093/emboj/19.5.831.

X-ray structure of MalY from Escherichia coli: a pyridoxal 5'-phosphate-dependent enzyme acting as a modulator in mal gene expression

Affiliations

X-ray structure of MalY from Escherichia coli: a pyridoxal 5'-phosphate-dependent enzyme acting as a modulator in mal gene expression

T Clausen et al. EMBO J. .

Abstract

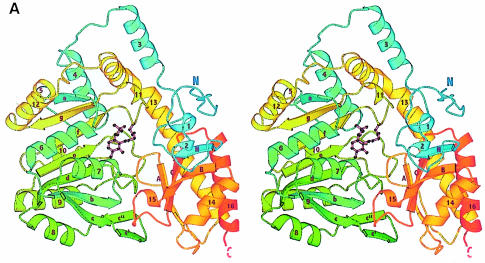
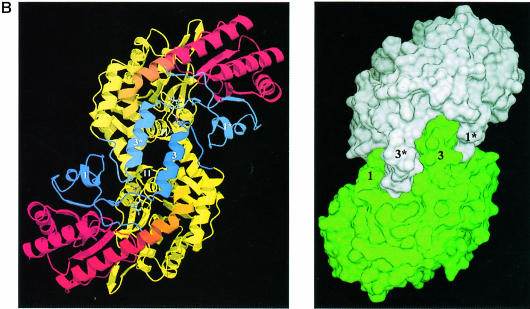
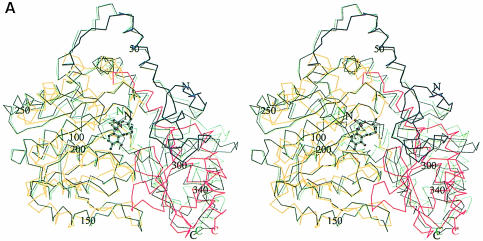
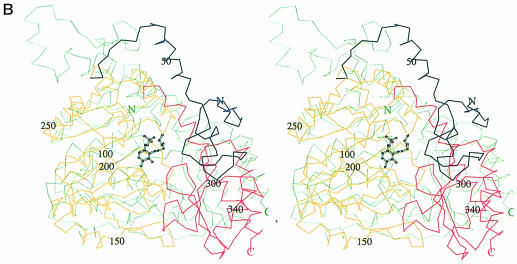
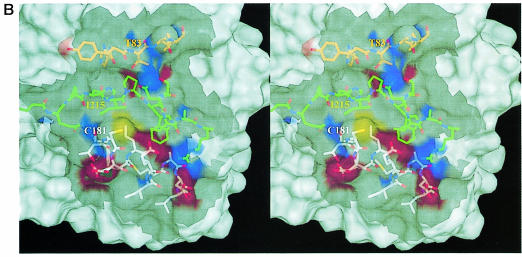
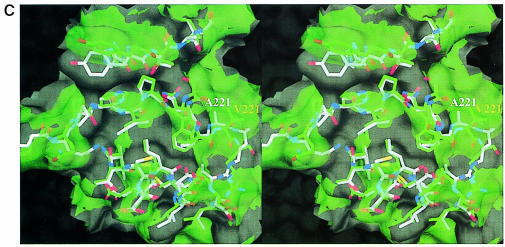
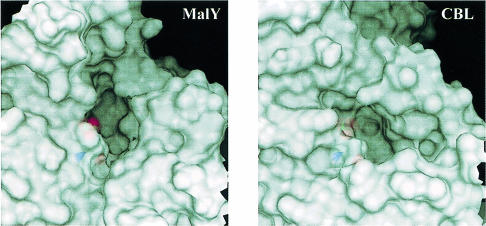
MalY represents a bifunctional pyridoxal 5'-phosphate-dependent enzyme acting as a beta-cystathionase and as a repressor of the maltose regulon. Here we present the crystal structures of wild-type and A221V mutant protein. Each subunit of the MalY dimer is composed of a large pyridoxal 5'-phosphate-binding domain and a small domain similar to aminotransferases. The structural alignment with related enzymes identifies residues that are generally responsible for beta-lyase activity and depicts a unique binding mode of the pyridoxal 5'-phosphate correlated with a larger, more flexible substrate-binding pocket. In a screen for MalY mutants with reduced mal repressor properties, mutations occurred in three clusters: I, 83-84; II, 181-189 and III, 215-221, which constitute a clearly distinguished region in the MalY crystal structure far away from the cofactor. The tertiary structure of one of these mutants (A221V) demonstrates that positional rearrangements are indeed restricted to regions I, II and III. Therefore, we propose that a direct protein-protein interaction with MalT, the central transcriptional activator of the maltose system, underlies MalY-dependent repression of the maltose system.


Figures

None
Fig. 1. Overall fold of MalY. (A) Stereo ribbon presentation of the MalY monomer, emphasizing the course of the polypeptide chain and the domain organization. The colour ramp starts at the N–terminus with blue and ends at the C–terminus with red. Both protein termini are labelled, as well as the nomenclature of the secondary structure elements. PLP and the PLP-binding lysine are shown in a ball-and-stick representation. Helices 2, 5, 10, 11 and 15 exhibit characteristics typical for 310 helices. (B) Active dimer of MalY viewed along the non-crystallographic 2–fold axis. In the ribbon presentation on the left, portions of the three segments are in blue (N–terminal), yellow (PLP-binding domain) and red (C–terminal). Helices that are central to dimer formation are marked. On the right, the dimer surface is illustrated in order to emphasize the zipper-like interaction interface between helices 1, 3*, 3, 1* and their associated loops. The colouring is based on the two monomers in the active dimer. The drawings were produced with MOLSCRIPT (Kraulis, 1991), RASTER3D (Merritt and Murphy, 1994) and DINO (Philippsen, 1999), respectively.
None
Fig. 2. Stereo plot of the DALI superpositions of the MalY monomer with (A) the open (black) and closed (green) form of AAT and (B) CBL. The different segments of MalY are coloured as in Figure 1B. The numbering of MalY, its cofactor and the individual polypeptide termini is indicated. The figures were generated with MOLSCRIPT.
None
Fig. 3. Active site of MalY. (A) Stereo plot of the final electron density of the PLP cofactor and the immediate protein vicinity (colour coded by atom type). The 2FoFc map is contoured at 1.1σ and calculated at 2.05 Å with the A221V reflection data. Water molecules are indicated by cyan balls. (B) Detailed comparison of the active site of MalY (colour coded by atom type) and AAT (green), resulting from a least-squares superposition as described in the text. Some important water molecules of the MalY active site are represented as grey balls. The residue labels of both structures are indicated. (C) Overlay of mechanistically important active site residues of MalY and CBL (orange). (B) and (C) were generated with SETOR (Evans, 1993), (A) and all the subsequent figures were generated with DINO.
None
Fig. 4. MalT-binding site. (A) The active dimer of MalY illustrating the location of the MalT interaction patch. The Cα traces of both monomers (white and green) are overlaid with a transparent surface. The MalT interaction regions are emphasized by a solid surface that was defined on the basis of the negative repressor mutants (drawn in red). The PLP cofactor is shown in a van der Waals representation. Note that the MalT-binding surface and the active site entrance to the PLP cofactor are located on opposite sides of the individual MalY monomers. (B) Spatial structure of the MalT-binding patch, which is constructed from the three segments I, II and III as described in the text. The C atoms of segments I, II and III are coloured orange (residues 81–85), white (residues 179–191) and green (residues 212–222), respectively. For each segment, the most important residue regarding MalT repression (Table II) is labelled. The model is overlaid with a transparent surface that is colour coded by atom type. (C) Overlay of the wild-type and A221V MalT interaction segments I, II and III. The wild-type model and the corresponding surface are in white, the A221V mutant in green. Obviously, the mutation Ala221 to Val221 results in a concerted structural reorientation of all three segments. The orientations of (B) and (C) are identical.
None
Fig. 5. Active site entrances of MalY (left) and CBL (right). The orientation and scaling of both figures are identical. The corresponding PLP cofactors are shown in a van der Waals representation below the surface. Part of the phosphate group of the MalY cofactor is directly accessible in the active site cleft.

Similar articles

Cited by

References

    1. Alexander F.W., Sandmeier, E., Mehta, P.K. and Christen, P. (1994) Evolutionary relationships among pyridoxal-5′-phosphate-dependent enzymes. Regio-specific α, β and γ families. Eur. J. Biochem., 219, 953–960. - PubMed
    1. Boos W. and Shuman, H. (1998) Maltose/maltodextrin system of Escherichia coli: transport, metabolism and regulation. Microbiol. Mol. Biol. Rev., 62, 204–229. - PMC - PubMed
    1. Bouma C.L. and Roseman, S. (1996) Sugar transport by the marine chitinolytic bacterium Vibrio furnissii–molecular cloning and analysis of the glucose and N-acetylglucosamine permeases. J. Biol. Chem., 271, 33457–33467. - PubMed
    1. Brünger A.T. (1992) XPLOR (Version 3.1) Manual. Yale University Press, New Haven, CT.
    1. Chapon C. (1982) Role of the catabolite activator protein in the maltose regulon of Escherichia coli. J. Bacteriol., 150, 722–729. - PMC - PubMed

MeSH terms