. 2000 Mar 1;19(5):843-51.
doi: 10.1093/emboj/19.5.843.

Tumorigenesis in mice with a fusion of the leukaemia oncogene Mll and the bacterial lacZ gene

Affiliations

Tumorigenesis in mice with a fusion of the leukaemia oncogene Mll and the bacterial lacZ gene

C L Dobson et al. EMBO J. .

Abstract

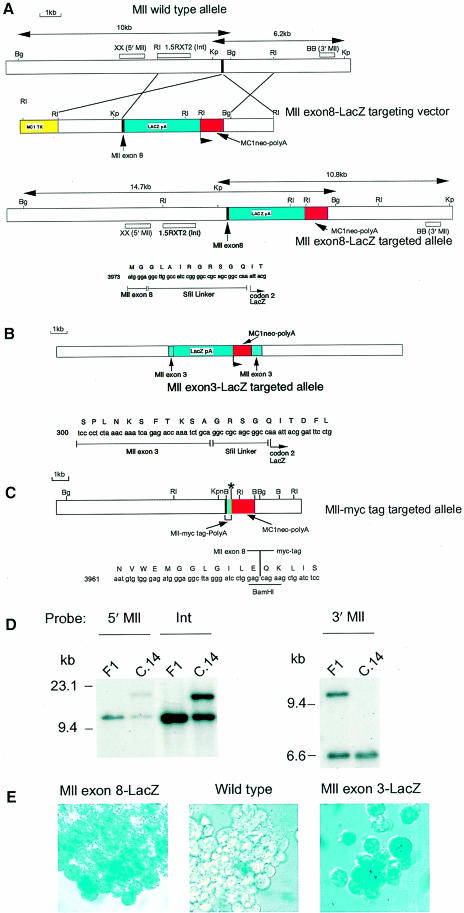
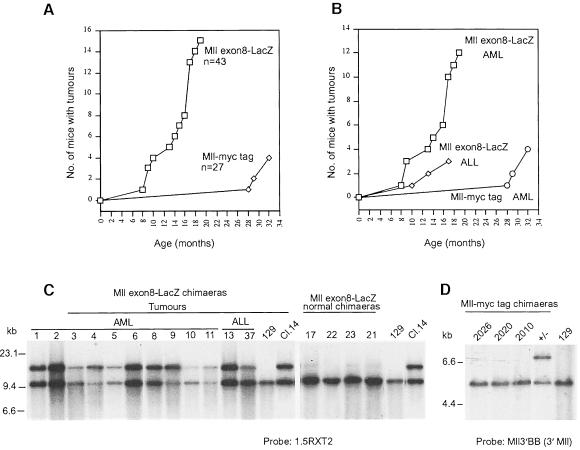
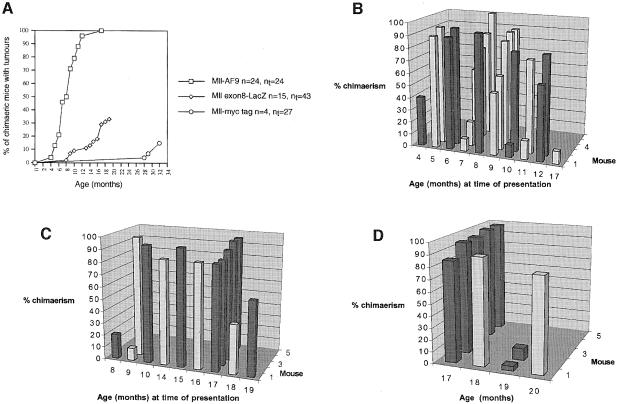
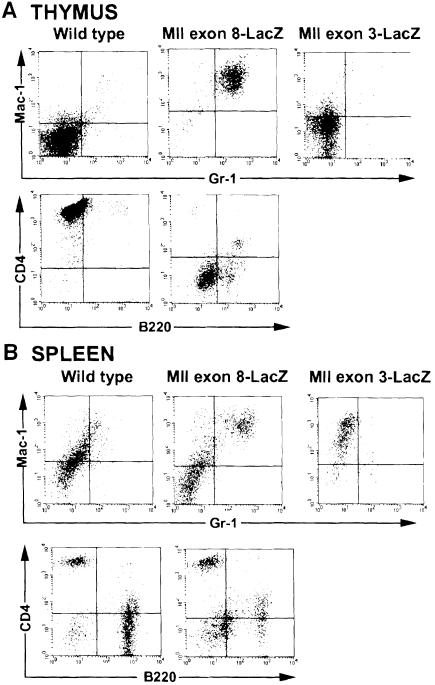
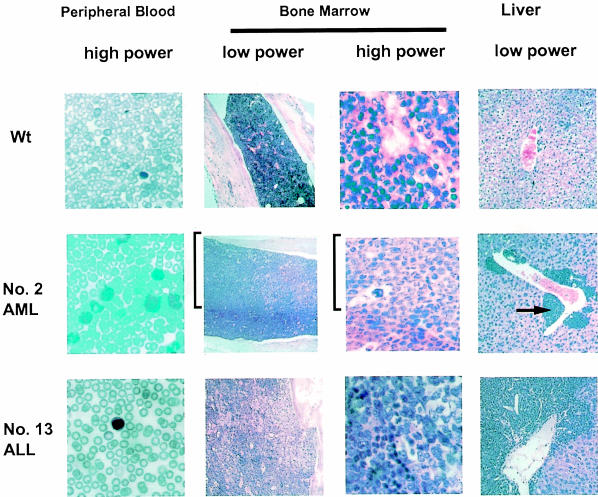
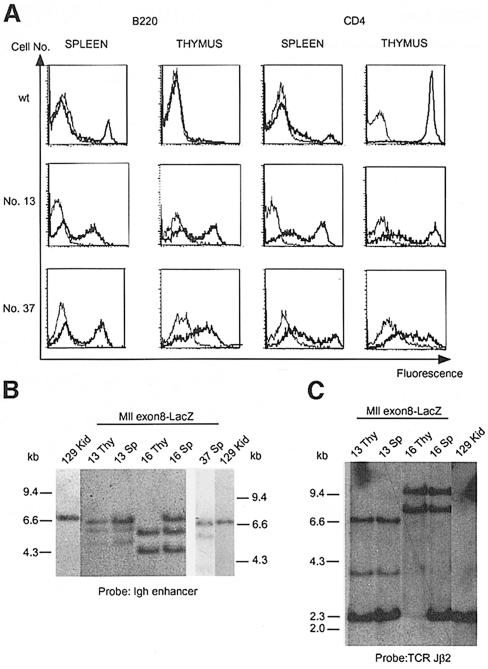
Many different chromosomal translocations occur in man at chromosome 11q23 in acute leukaemias. Molecular analyses revealed that the MLL gene (also called ALL-1, HRX or HTRX) is broken by the translocations, causing fusion with genes from other chromosomes. The diversity of MLL fusion partners poses a dilemma about the function of the fusion proteins in tumour development. The consequence of MLL truncation and fusion has been analysed by joining exon 8 of Mll with the bacterial lacZ gene using homologous recombination in mouse embryonic stem cells. We show that this fusion is sufficient to cause embryonic stem cell-derived acute leukaemias in chimeric mice, and these tumours occur with long latency compared with those found in MLL-Af9 chimeric mice. These findings indicate that an MLL fusion protein can contribute to tumorigenesis, even if the fusion partner has no known pathogenic role. Thus, truncation and fusion of MLL can be sufficient for tumorigenesis, regardless of the fusion partner.


Figures

None
Fig. 1. Mll gene targeting lacZ fusion constructs and β–galactosidase expression. (A) The Mll–exon8–lacZ targeting construct. The top map represents the Mll wild-type allele, indicating the position of exon 8 (black box) and positions of probes used to evaluate the gene targeting. Below this is a map of the Mll–exon8–lacZ targeting construct indicating the location of the LacZ fusion (blue box) in Mll exon 8, together with the MC1-neo-pA resistance gene (red box) (located downstream of the Mll–lacZ fusion gene). The MC1-tk-pA cassette (Thomas and Capecchi, 1987) [encoding the HSV thymidine kinase gene (yellow box)] is upstream of the fusion gene to allow negative selection of non-homologous integrations. The regions of homology between the Mll–exon8–lacZ targeting construct and the germ-line Mll gene are indicated. The bottom map indicates the expected organization of the Mll locus in the targeted allele together with the junctional sequence between Mll exon 8 and the lacZ gene fusion, including the SfiI linker, which was incorporated at the BamHI site to facilitate insertion of the lacZ-MC1-neo-pA cassette. The positions of the three DNA probes used to assess the gene targeting are indicated [XX, 5′ Mll; 1.5RXT2, internal (Int); BB, 3′ Mll]. (B) Organization of the Mll–exon3–lacZ targeted allele (previously AT-lac; Corral et al., 1996) and the junctional sequence between Mll exon 3 and the lacZ gene fusion. (C) Organization of the Mll–myc tag targeted allele (previously Mll–myc; Corral et al., 1996) and the junctional sequence between Mll exon 8 and the myc epitope tag fusion. (D) Southern filter hybridization of DNA from ES cells with targeted Mll–exon8–lacZ alleles. Three independent targeted ES clones were derived, two made in E14 ES cells (clones 14 and 24) and one in CCB ES cells (clone 118). Filter hybridization of clone 14 is shown for representation, in comparison with wild-type (F1 mouse kidney) DNA. Genomic DNA was digested with either BglII or KpnI. BglII-digested DNA was hybridized with the probe XX (5′ Mll) from outside the targeting vector and with the probe p1.5RXT2 (Int), which is located internally in the targeting vector. KpnI-digested DNA was hybridized with the probe BB (3′ Mll) from outside the targeting vector. In each case, the lower band represents the germ-line band and the larger band the targeted allele). Confirmation that a single insertion had occurred in each cell line was obtained by re-probing with a neo probe (data not shown). (E) β-galactosidase staining of targeted ES cells. ES cells targeted with either Mll–exon8–lacZ clone 14, Mll–exon3–lacZ or wild-type E14 ES cells were prepared and fixed with 2% formaldehyde/0.2% glutaraldehyde before staining for 48 h with X-gal solution. Cells were transferred to glass slides for photography. Both Mll–exon8–lacZ- and Mll–exon3–lacZ-targeted ES cells stain blue with X-gal.
None
Fig. 2. Tumour incidence in Mll–lacZ mice. Tumour incidence was monitored in cohorts of mice and when signs of indolence or unhealthy coat appeared, animals were killed and post-mortems carried out. (A) Data showing incidence of Mll–lacZ mice with detectable tumours compared with a cohort of Mll–myc tag mice (plotted as numbers of mice with time in months). The cohort size of the Mll–lacZ mice was 43 and that of the Mll–myc tag mice was 27. (B) Data showing the incidence of AML versus ALL within cohorts of Mll–lacZ and Mll–myc tag mice. Distinct forms of disease were found to be AML or ALL and lymphoma in the groups of mice as indicated. (C) Southern filter hybridization of DNA from Mll–lacZ chimeric animals with acute leukaemia. DNA was prepared from the spleen of the chimeras indicated (1–6 and 8–11 diagnosed with AML and 13 and 37 diagnosed with ALL), or chimeras not afflicted with discernible disease (17, 22, 23 and 21). DNA was digested with BglII, separated on 0.8% agarose alongside 129 liver DNA and DNA from Mll–lacZ ES clone 14, both digested with BglII. After transfer to nylon membranes, hybridization was carried out with 32P-labelled probe 1.5RXT2. The upper band represents the targeted allele (found in clone 14) and the lower band represents the germ-line allele. (D) Southern filter hybridization of DNA from Mll–myc tag chimeric animals with acute leukaemia. DNA was prepared from the spleen of the chimeras indicated (2026, 2020, 2010 diagnosed with AML) digested with KpnI, separated on 0.8% agarose alongside 129 liver DNA and DNA from an Mll–myc tag heterozygous mouse. After transfer to nylon membranes, hybridization was carried out with 32P-labelled probe BB (3′ Mll probe). The upper band represents the targeted allele (found in clone 14) and the lower band represents the germ-line allele.
None
Fig. 3. Relationship between chimerism and tumour incidence in Mll–lacZ mice. Comparison of tumour incidence and coat colour chimerism in Mll–lacZ and Mll–AF9 mice. (A) Comparative tumour incidence in the cohort of chimeric mice made with the Mll–lacZ ES cells and cohorts of Mll–myc tag and Mll–AF9 chimeric mice. n, number of mice that developed tumours; nt, number of mice in the cohort. (B) Histograms showing the estimated coat colour chimerism in mice derived from injection of targeted ES cells with Mll–AF9 and time of leukaemia incidence. (C) Histograms showing the estimated coat colour chimerism in mice derived from injection of targeted ES cells with Mll–lacZ and time of leukaemia incidence. (D) Histograms showing the level of estimated coat colour chimerism in those Mll–lacZ mice that were culled for post-mortem examination without symptoms or pathology of leukaemia.
None
Fig. 4. FACS analysis of tumours from Mll–lacZ mice. Single-cell suspensions were made from spleen and thymus of an Mll–lacZ mouse (mouse number 6) with symptoms of disease and from Mll–exon3–lacZ or wild-type mice. Cells were stained with an anti-Mac–1 antibody coupled with PE together with an anti-Gr–1 antibody coupled with FITC or with an anti-CD4 antibody coupled with PE together with an anti-B220 antibody coupled with FITC. The markers were Gr–1, Mac–1 (alone or together) to detect myeloid populations, and CD4 or B220 to detect T- or B-cell populations, respectively. (A) Thymus cell populations; (B) spleen cell populations.
None
Fig. 5. Histology of haematological tumours arising in Mll–lacZ mice. Tissues were dissected and fixed in 10% formalin. Paraffin sections were prepared and stained with H&E. Blood films were stained with MGG. Comparison of tissues from Mll–lacZ mice with those from a normal C57/Bl6 wild-type mouse. Mll–lacZ mouse number 2 had AML and number 13 had ALL. The tissues from the Mll–lacZ mouse 2 show infiltration with myeloblastic tumour cells, e.g. the arrow indicates the location of the myeloblasts around a blood vessel in the liver of the Mll–lacZ mouse. These myeloid tumour cells are located next to and within the centrilobular vein. A band of myeloblasts (bracketed region) is seen adjacent to a layer of darker normal cells in the bone marrow. Mll–lacZ mouse number 13 had a lymphoblastic lymphoma with few lymphoid cells in peripheral blood, with patches of tumour cells in the bone marrow but large amounts of tumour cells surrounding the veins in liver. Low or high power magnifications are indicated.
None
Fig. 6. Clonality of ALL tumours arising in Mll–lacZ chimeras. Three animals from the Mll–lacZ cohort developed ALL according to post-mortem examination and histological analysis. The spleen and thymus cells from these mice were isolated for FACS analysis of lymphoid surface marker analysis (A), and DNA prepared for hybridization analysis of the rearrangement status of Ig heavy chain genes (B) and TCR genes (C). (A) Spleen and thymus cells were prepared from a C57/Bl6 mouse (control) and Mll–lacZ tumour mice numbers 13 and 37. The cells were incubated with antibodies recognizing B220 and CD4 antigens. The stained cells were analysed on a FACSCALIBUR instrument. The thinner line represents the signal obtained with an isotype control for B220 or CD4, respectively. The thick line represents the signal obtained with stained mouse cells. (B) Autoradiograph of a filter hybridization using an IgH-chain enhancer probe (Neuberger et al., 1989). Spleen and thymus DNA from Mll–lacZ mice numbers 13, 16 and 37 (ALL tumours) were digested with EcoRI (compared with 129 kidney DNA) prior to gel separation, transfer to nylon and hybridization. The DNA shows similar rearrangement patterns between spleen and thymus in each mouse. Each of these ALL-bearing Mll–lacZ has clonal IgH rearrangements. (C) Autoradiograph of a filter hybridization using a TCR Jβ2 probe (Malissen et al., 1984). Spleen and thymus DNA from Mll–lacZ mice numbers 13 and 16 were digested with EcoRI (compared with 129 kidney DNA) prior to gel separation, transfer to nylon and hybridization. The DNA shows similar rearrangement patterns between spleen and thymus in each Mll–lacZ mouse. Mll–lacZ mouse 37 had no evidence of TCR rearrangement (data not shown). Autoradiography was for 16 h.

Similar articles

Cited by

References

    1. Atlas M., Head, D., Behm, F., Schmidt, E., Zeleznik-Le, N.J., Roe, B.A., Burian, D. and Domer, P.H. (1998) Cloning and sequence analysis of four t(9;11) therapy-related leukemia breakpoints. Leukemia, 12, 1895–1902. - PubMed
    1. Bernard O. and Berger, R. (1995) Molecular basis of 11q23 rearrangements in hematopoietic malignant proliferations. Genes Chromosomes Cancer, 13, 75–85. - PubMed
    1. Chaplin T., et al. (1995a) A novel class of zinc finger/leucine zipper genes identified from the molecular cloning of the t(10;11) translocation in acute leukemia. Blood, 85, 1435–1441. - PubMed
    1. Chaplin T., Bernard, O., Beverloo, H.B., Saha, V., Hagemeijer, A., Berger, R. and Young, B.D. (1995b) The t(10;11) translocation in acute myeloid leukemia (M5) consistently fuses the leucine zipper motif of AF10 onto the HRX gene. Blood, 86, 2073–2076. - PubMed
    1. Cimino C., et al. (1997) Infant acute leukemias show the same biased distribution of ALL1 gene breaks as topoisomerase II related secondary acute leukemias. Cancer Res., 57, 2879–2883. - PubMed

Publication types

Substances

LinkOut - more resources