. 2000 Mar 1;19(5):1023-33.
doi: 10.1093/emboj/19.5.1023.

Hormone activation induces nucleosome positioning in vivo

Affiliations

Hormone activation induces nucleosome positioning in vivo

S Belikov et al. EMBO J. .

Abstract

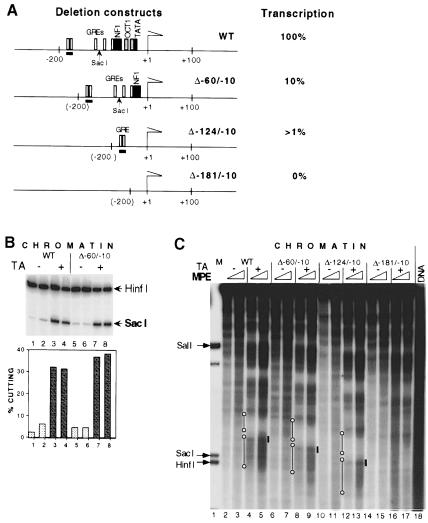
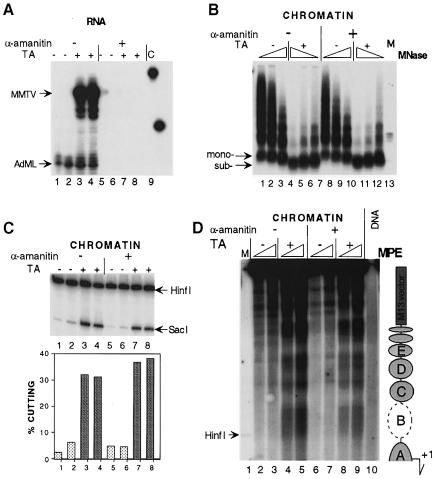
The mouse mammary tumor virus (MMTV) promoter is induced by glucocorticoid hormone. A robust hormone- and receptor-dependent activation could be reproduced in Xenopus laevis oocytes. The homogeneous response in this system allowed a detailed analysis of the transition in chromatin structure following hormone activation. This revealed two novel findings: hormone activation led to the establishment of specific translational positioning of nucleosomes despite the lack of significant positioning in the inactive state; and, in the active promoter, a subnucleosomal particle encompassing the glucocorticoid receptor (GR)-binding region was detected. The presence of only a single GR-binding site was sufficient for the structural transition to occur. Both basal promoter elements and ongoing transcription were dispensable. These data reveal a stepwise process in the transcriptional activation by glucocorticoid hormone.


Figures

None
Fig. 1. Reconstitution of glucocorticoid regulation in Xenopus oocytes. (A) The reporter DNA construct, the pMTV:M13 coding vector with the primer used for primer extension analysis of the SacI in situ accessibility assay (solid black arrow) and the restriction enzyme cleavage sites that are referred to in the text. White boxes, GRE hexanucleotide elements; black box, NF1 site; light gray box, OCT 1 site; and dark gray box, TATA-box sequence. (B) GR expression in oocytes. Western blot of SDS–PAGE: lane 1, GR prepared from rat liver (Perlmann and Wrange, 1988); lanes 2 and 3, one Xenopus oocyte equivalent was analyzed 24 h after injection of 5 ng of pSTC GR 3-795 expression vector; lane 4, one oocyte equivalent injected with 5 ng of in vitro transcribed GR RNA 24 h before analysis. Hormone (TA, 1 μM) was added as indicated. (C) Hormone-dependent MMTV transcription in Xenopus oocytes. Transcription analysis by S1 nuclease protection of MMTV and the AdML promoter. Oocytes in groups of five were injected with 1 ng of pMTV:M13 coding vector ssDNA and 0.25 ng of pAdML reference and either 5 ng of GR expression vector (pSTC GR 3-795) (lanes 3 and 4) or 5 ng of in vitro transcribed GR RNA (lanes 5–7). After 24 h, hormone (TA, 1 μM) was added to oocyte culture media and oocytes were harvested for RNA analysis at the time indicated.
None
Fig. 2. Chromatin structure of the MMTV promoter. (A) Hormone-dependent DNase I-hypersensitive sites are located in the MMTV LTR. Groups of 12 oocytes were injected with 1 ng of pMTV:M13 coding ssDNA, 5 ng of dsDNA for pSTC GR 3-795 and 0.25 ng for pAdML reference (lanes 1–8). After overnight incubation, hormone was added (TA; 1 μM) (lanes 1–4) or not added (lanes 5–8) and oocytes were harvested after 24 h for the DNase I hypersensitivity assay. Lane 9, internal molecular weight marker showing the position of the SacI restriction enzyme cut. Lane 10, naked dsMMTV promoter DNA digested with DNase I. (B) MNase in situ digestion shows hormone-dependent disruption of the canonical nucleosome structure in the vicinity of GRE elements. Groups of 10 oocytes were injected. The next day, hormone (TA; 1 μM) was added as indicated and oocytes were harvested after 24 h for MNase digestion. DNA was resolved in an agarose gel, transferred and hybridized with a labeled MMTV promoter probe encompassing region –192/–100, and then washed and rehybridized with an M13 vector probe. Lane 1, internal DNA marker; lane 2, naked dsMMTV promoter DNA digested with MNase. The arrow shows a subnucleosomal particle ∼120 bp DNA fragment revealed only after hybridization with specific probe.
None
Fig. 3. Evaluation of the effect of time and hormone concentration on hormone-induced chromatin remodeling. (A) Oocytes were injected with 10 ng of GR RNA and 1 ng of ssDNA pMTV:M13 coding strand, and 0.25 ng of pAdML for reference. After overnight incubation, oocytes were divided into 12 groups of five oocytes each; 1 μM TA was added at various times. Oocytes were homogenized and two-thirds taken for SacI in situ accessibility assay and one-third for RNA analysis (not shown). White diamonds signify each individual analysis as quantified by PhosophorImager, and black diamonds the mean value for each double sample. (B) Oocytes were injected with DNA and GR RNA (+GR-RNA) or with DNA only (–GR-RNA) and the next day divided into 16 groups with six oocytes in each and treated with the indicated concentrations of hormone (TA) for 9 h and then homogenized. Two-thirds was taken for SacI and one-third for RNA analysis. Symbols as in (A). Log [TA] is given on the abscissa. (C) Quantitaion of MMTV RNA relative to AdML RNA of the experiment described in (B) using S1 nuclease protection assay and PhosphorImager analysis, arbitrary units (A.U.). Symbols as in (A).
None
Fig. 4. Hormone-induced nucleosome positioning analyzed by MPE and MNase digestion in situ. (A and B) Transcriptional activation leads to establishment of nucleosome positioning along the MMTV promoter. Injected oocytes were analyzed after 24 h of hormone treatment. MPE digestion was performed for 3 min (lanes 2 and 4) and 10 min (lanes 3 and 5). Isolated DNA was digested with SalI and EcoRV, resolved on agarose, blotted and hybridized first with a random-primed labeled fragment adjacent to the EcoRV site (EcoRV–SacI fragment in A) and then stripped and reprobed with SalI–RsaI (B). Lanes 1 and 7, internal molecular weight markers (see map to the right); lanes 2–5, MPE digestion of injected oocytes, treated (lanes 4 and 5) and not treated (lanes 2 and 3) with hormone; lane 6, naked dsMMTV promoter DNA digested with MPE. To the right in (A) and (B) is a schematic summary of MPE cuts along the MMTV LTR with putative nucleosome positions. (C) Mapping of dinucleosome borders suggests that nucleosomes are translationally positioned along the MMTV promoter only after activation of transcription. Groups of 10 oocytes were hormone treated as in (A) and (B) and MNase digested as in Figure 2B (lanes 3 and 8). DNA was isolated and resolved in a 4% NuSieve GTG agarose gel together with size markers. The band corresponding to dinucleosome DNA (360–370 bp in length) was excised from the gel, DNA was eluted and analyzed as a control (lanes 1 and 4) or digested either with HinfI (lanes 2 and 5) or RsaI (lanes 3 and 6). DNA was resolved in a 1% SeaKem GTG + 2.5% NuSieve GTG agarose gel, blotted and hybridized with a random-primed probe encompassing region –415/–100. Black dots outline the DNA bands revealed by hybridization. (D) Chromatin organization of the MMTV promoter as revealed by MNase and MPE mapping. A magnified section of lanes 3 and 4 in (A) is shown together with a schematic presentation of the MMTV LTR and the restriction enzyme cleavage sites. All symbols are as in Figure 1A. The positions of the nucleosomes (on the right) are based on the results in (A–C). The co-localizations of MPE cuts with internucleosome linkers and/or factor-binding sites are indicated by arrows.
None
Fig. 5. Nucleosome remodeling and establishment of nucleosome positioning are dependent on GR binding but not on other basal promotor elements. (A) Maps of MMTV deletion mutants. Names of mutants signify the base pairs that were deleted relative to the transcription initiation start (+1). The strong GRE site at position –185/–171 in the wild type and the corresponding site in Δ–60/–10 and Δ–124/–10 mutants are underlined. Hormone-dependent transcriptional efficiency relative to wild type, as measured by S1 nuclease protection, is given on the right. (B) Nucleosome remodeling in the vicinity of the GRE elements in wild type (lanes 1–4) and Δ–60/–10 mutant (lanes 5–8) as revealed by SacI restriction enzyme accessibility assay. Groups of five oocytes were subjected to the SacI restriction enzyme accessibility assay. Arrows show specific bands generated by SacI and HinfI. The diagram below shows SacI cutting as a percentage of total DNA. (C) MPE analysis. See Figure 4A legend for details. Lane 1, internal molecular weight marker, showing the positions of HinfI and SacI restriction enzyme cuts. Lanes 2–17, wild-type or mutant ssDNA injected as indicated. Lane 18, naked dsMMTV promoter DNA digested with MPE. Solid black lines mark the position of the strong GRE elements at –185/–171 in the wild type and in Δ–60/–10 and Δ–124/–10 mutants. Open circles connected with a black line mark the hormone-induced positioning of nucleosomes C and B (from top to bottom).
None
Fig. 6. Nucleosome remodeling and establishment of translational nucleosome positioning are not dependent on ongoing transcription. (A) Transcription analysis by S1 nuclease protection of MMTV and AdML RNA. In half of the oocytes, α–amanitin was co-injected together with the DNA (lanes 5–8). After 24 h, 1 μM TA was added (lanes 3, 4, 7 and 8) or not added (lanes 1, 2, 5 and 6) and oocytes were harvested another 24 h later for RNA analysis. Lane 9, undigested S1 probe. (B) MNase analysis. DNA was resolved in agarose, transferred and hybridized with a probe encompassing region –192/–100 of MMTV. Arrows show positions for mononucleosomal (mono-) and subnucleosomal (sub-) particles. (C) SacI accessibility assay. Oocytes in groups of six for each analysis. Symbols as in Figure 5B. (D) MPE footprinting. Oocytes in groups of seven were analyzed by MPE digestion. Isolated DNA was assayed according to the indirect end-labeling protocol as in Figure 4A except that digested DNA was only cleaved with EcoRV (+425). Lane 1, internal molecular weight marker, showing the positions of HinfI cleavage. Lane 10, naked dsMMTV promoter DNA digested with MPE. To the right is a schematic summary of MPE cuts along the MMTV LTR with putative nucleosome positions.

Similar articles

Cited by

References

    1. Almouzni G. and Wolffe, A.P. (1993) Replication-coupled chromatin assembly is required for repression of basal transcription in vivo. Genes Dev., 7, 2033–2047. - PubMed
    1. Archer T.K., Cordingley, M.G., Wolford, R.G. and Hager, G.L. (1991) Transcription factor access is mediated by accurately positioned nucleosomes on the mouse mammary tumor virus promoter. Mol. Cell. Biol., 11, 688–698. - PMC - PubMed
    1. Archer T.K., Lefebvre, P., Wolford, R.G. and Hager, G.L. (1992) Transcription factor loading on the MMTV promoter: a bimodal mechanism for promoter activation. Science, 255, 1573–1576. - PubMed
    1. Bresnick E.H., Bustin, M., Marsaud, V., Richard-Foy, H. and Hager, G.L. (1992) The transcriptionally-active MMTV promoter is depleted of histone H1. Nucleic Acids Res., 20, 273–278. - PMC - PubMed
    1. Buetti E. and Kuhnel, B. (1986) Distinct sequence elements involved in the glucocorticoid regulation of the mouse mammary tumor virus promoter identified by linker scanning mutagenesis. J. Mol. Biol., 190, 379–389. - PubMed

Publication types