. 2000 Mar 1;19(5):1034-44.
doi: 10.1093/emboj/19.5.1034.

Loss of FBP function arrests cellular proliferation and extinguishes c-myc expression

Affiliations

Loss of FBP function arrests cellular proliferation and extinguishes c-myc expression

L He et al. EMBO J. .

Abstract

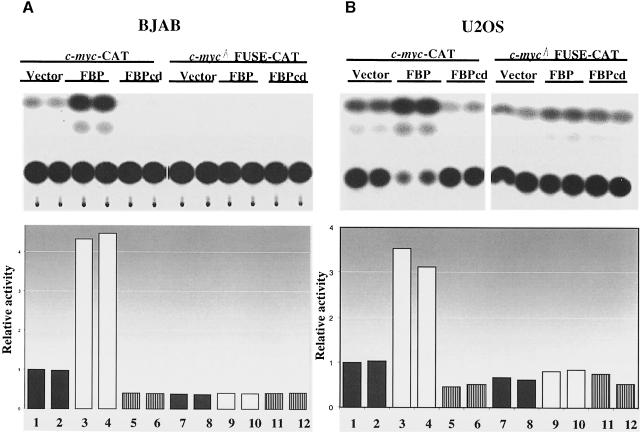
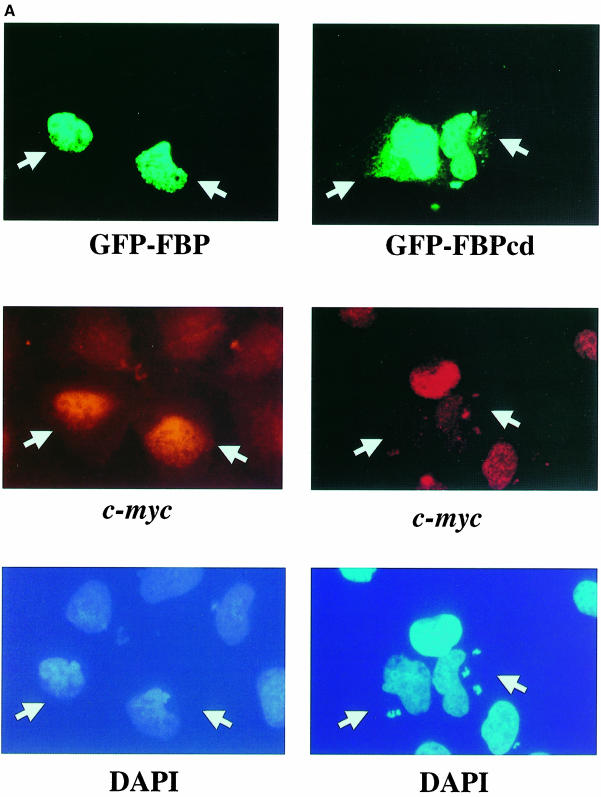
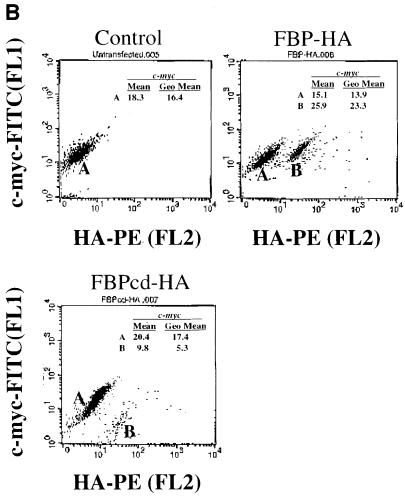
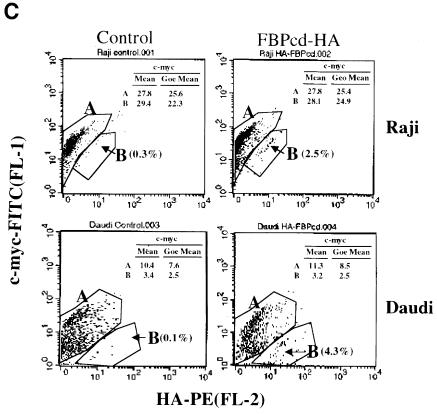
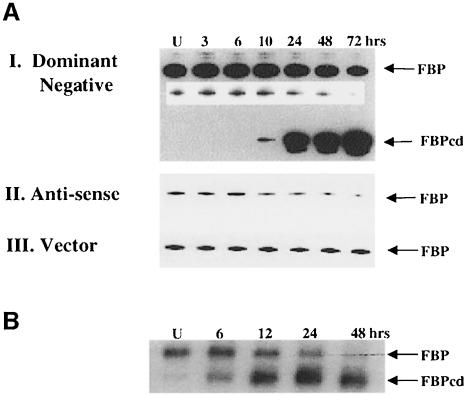
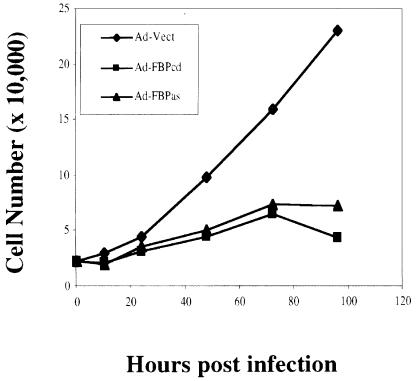
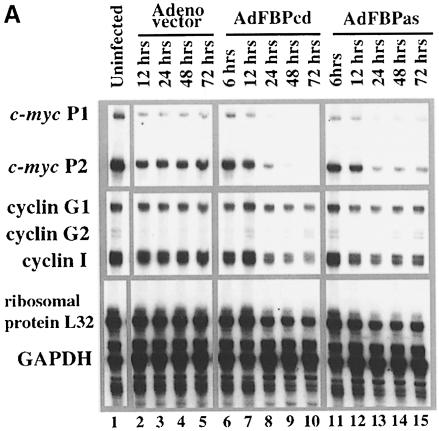
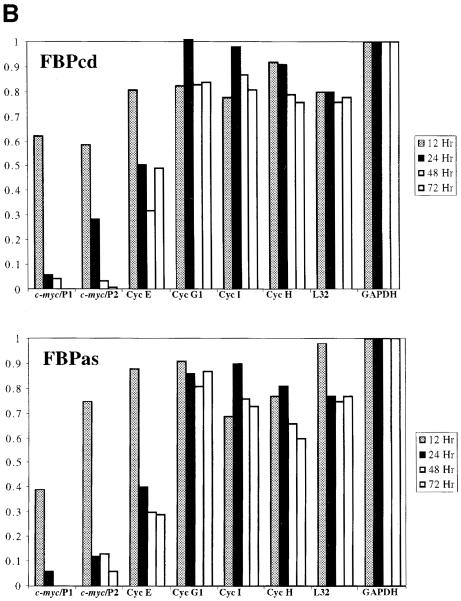
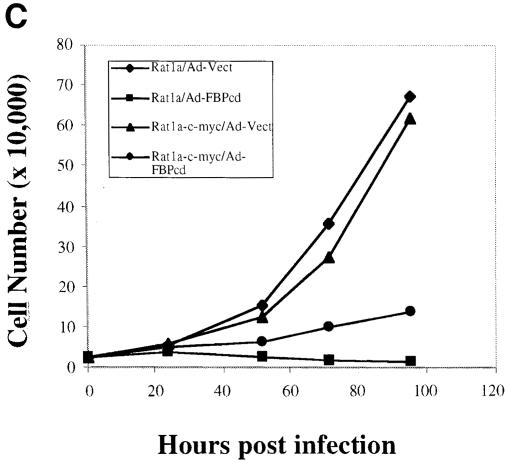
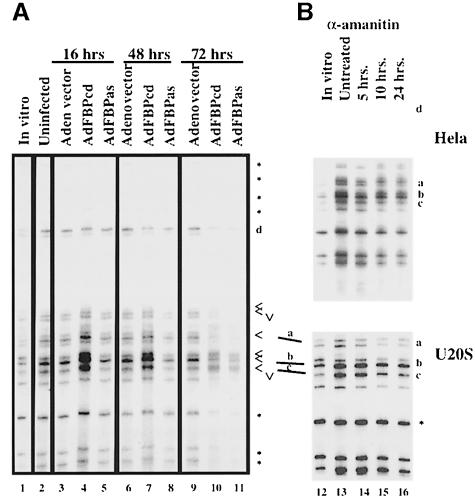
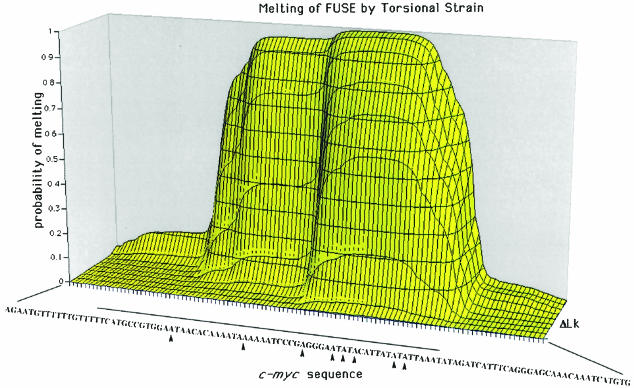
The c-myc regulatory region includes binding sites for a large set of transcription factors. The present studies demonstrate that in the absence of FBP [far upstream element (FUSE)-binding protein], which binds to the single-stranded FUSE, the remainder of the set fails to sustain endogenous c-myc expression. A dominant-negative FBP DNA-binding domain lacking effector activity or an antisense FBP RNA, expressed via replication-defective adenovirus vectors, arrested cellular proliferation and extinguished native c-myc transcription from the P1 and P2 promoters. The dominant-negative FBP initially augmented the single-stranded character of FUSE; however, once c-myc expression was abolished, melting at FUSE could no longer be supported. In contrast, with antisense FBP RNA, the single-stranded character of FUSE decreased monotonically as the transcription of endogenous c-myc declined. Because transcription is the major source of super-coiling in vivo, we propose that by binding torsionally strained DNA, FBP measures promoter activity directly. We also show that FUSE is predicted to behave as a torsion-regulated switch poised to regulate c-myc and to confer a higher order regulation on a large repertoire of factors.


Figures

None
Fig. 1. The FUSE mediates activation by full-length FBP or repression by the DNA-binding central domain. Plasmids (5 μg) directing the expression of either full-length FBP (lanes 3, 4, 9 and 10), the DNA-binding central domain (FBPcd, lanes 5, 6, 11 and 12) or the vector alone (lanes 1, 2, 7 and 8) were co-transfected with a c-myc promoter–CAT reporter gene into the B-cell line BJAB (A) or the osteosarcoma cell line U20S (B). Reporters used the wild-type c-myc promoter (pMP-CAT, 5 μg, lanes 1–6) or FUSE-deleted c-myc promoter (pMP-CAT-ΔFUSE, 5 μg, lanes 7–12). TLC plates were quantitated using a phosphoimager and Image-Quant software.
None
Fig. 2. Expression of the FBP central domain (FBPcd) decreases endogenous myc protein, whereas overexpression of FBP increases c-myc. (A) U2OS cells were transfected with GFP–FBPcd (left) or GFP–FBP (right). After 16 h, all cells were stained for DNA with DAPI (bottom), processed for immunostaining with anti-c-myc primary antibody and rhodamine-conjugated secondary antibody (middle) and transfected cells were identified by GFP fluorescence (top panel). The arrows indicate transfected cells identified by GFP fluorescence. (B) Plasmids directing the synthesis of FBP-HA or FBPcd-HA were transfected into U2OS cells, immunostained for myc and HA, and analyzed with FACS. HA-positive cells formed a discrete population with increased (middle) or decreased (left) c-myc. (C) FBPcd-HA was transfected into both FUSE-minus Raji and FUSE-positive Daudi cells (right panels) and immunostained as in (B). HA-positive (region B; top right panel) and HA-negative Raji cells (region A) displayed similar levels of c-myc whereas HA-positive Daudi cells (region B, bottom right panel) showed reduced levels of c-myc compared with cells not expressing FBP-interacting repressor (region A). Left panels show c-myc levels in mock-transfected cells. The region corresponding to FBPcd-transfected cells is enclosed by a red line and labeled B. The number of cells in regions B for control versus HA-FBPcd-transfected cells was 180 versus 2179 for Raji, and 92 versus 2907 for Daudi. The percentage of total cells transfected is indicated at region B.
None
Fig. 3. Adenoviruses expressing dominant-negative FBPcd or antisense FBP RNA down-modulate endogenous FBP. U2OS osteosarcoma cells were infected with replication-defective adenoviruses expressing dominant-negative FBP (AdFBPcd) or antisense FBP RNA (AdFBPas). (A) Time course of FBP expression monitored by immunoblot with anti-FBP; the top panel shows the accumulation of FBPcd with the parallel decline of endogenous FBP (inset shows a shorter exposure). The middle panel shows the decline of FBP in response to antisense FBP RNA, and the lower panel shows that FBP levels do not respond to adenovirus vector. (B) Time course of FBPcd mRNA accumulation and FBP mRNA decline in response to AdFBPcd; RNA extracted from AdFBPcd-infected cells was analyzed by Northern blot.
None
Fig. 4. Dominant-negative FBP or antisense FBP RNA arrest cellular proliferation. Growth curve of U2OS cells infected with AdFBPcd, AdFBPas or replication-defective adenovirus vector alone.
None
Fig. 5. FBP function is required to maintain c-myc expression. (A) Total RNA (10 μg) extracted from cells infected with AdFBPcd (lanes 6–10), AdFBPas (lanes 11–15), adenovirus vector (lanes 2–5) or uninfected cells at the indicated times was analyzed with a multiplex RNase protection assay using an SP6 RNA polymerase-generated probe for c-myc and T7 RNA polymerase-generated probes for cyclin G1, cyclin G2, cyclin I, ribosomal protein L32 and glyceraldehyde phosphate dehydrogenase (GAPDH). After hybridization and RNase digestion, the protected fragments were visualized by autoradiography after electrophoresis on a 6% denaturing polyacrylamide gel. (B) The intensity of the protected fragment for each RNA (and cyclins E and H, not shown) from AdFBPcd- and AdFBPas-infected cells was determined (Image-Quant Tools software) and expressed as a ratio relative to the same RNA from adenovirus vector-infected cells harvested at the same time. GAPDH levels were used to normalize for loading. (C) Expression of c-myc from a heterologous promoter partially reversed FBPcd-induced growth arrest in Rat1a cells. Rat1a or Rat1a-myc cells (Stone et al., 1987; Hoang et al., 1994) were infected with AdFBPcd, counted and scored for viability by the exclusion of Trypan blue at the indicated times post-infection.
None
Fig. 6. FBPcd enhances and antisense FBP weakens melting at FUSE. (A) Cells infected with AdFBPcd (lanes 4, 7 and 10), AdFBPas (lanes 5, 8 and 11), adenovirus vector (lanes 3, 6 and 9) or uninfected cells (lane 2), as well as naked DNA (lane 1) were treated with KMnO4 to oxidize single-stranded DNA in vivo and processed for ligation-mediated PCR. Infections proceeded for the time indicated prior to treatment. * indicates bases approximately equivalently reactive in all cells; < indicates bases relatively more reactive in vivo and hyperreactive due to FBPcd; v indicates bases becoming hyporeactive when c-myc expression shuts off. (B) Treatment with the transcription inhibitor α-amanitin gradually abolished the hyperreactivity of bases in FUSE to KMnO4 in both HeLa and U2OS cells. Note that the same bases (marked a, b and c) made hyperreactive by FBPcd are made less reactive by α-amanitin.
None
Fig. 7. The sequence of the FUSE is tuned to melt biphasically between superhelical density –0.04 and –0.06. A 3.2 kb segment of the c-myc sequence extending downstream of the HindIII site (–2329) was analyzed for melting probability as a function of superhelical density. Only the FUSE responded to the strain applied to the c-myc promoter. The sequence of FUSE is shown (bottom) along with the probability of melting (vertical) and the linking number deficit (ΔLk) starting at –12, which corresponds to superhelical density σ = –0.039; subsequent (ΔLk, σ) are (–13, –0.042), (–14, –0.046), (–15, –0.049), (–16, –0.052), (–17, –0.055), (–18, –0.058), (–19, –0.062) and (–20, –0.065). Hyperreactive bases on the bottom strand are marked with arrowheads. The FUSE region is indicated by the line, which embraces hyper- and hyporeactive bases on both strands. (Duncan et al., 1994; Michelotti et al., 1996).

Similar articles

Cited by

References

    1. Aghib D.F., Bishop, J.M., Ottolenghi, S., Guerrasio, A., Serra, A. and Saglio, G. (1990) A 3′ truncation of MYC caused by chromosomal translocation in a human T-cell leukemia increases mRNA stability. Oncogene, 6, 707–711. - PubMed
    1. Albert T., Mautner, J., Funk, J.O., Hortnagel, K., Pullner, A. and Eick, D. (1997) Nucleosomal structures of c-myc promoters with transcriptionally engaged RNA polymerase II. Mol. Cell. Biol., 17, 4363–4371. - PMC - PubMed
    1. Avigan M.I., Strober, B. and Levens, D. (1990) A far upstream element stimulates c-myc expression in undifferentiated leukemia cells. J. Biol. Chem., 265, 18538–18545. - PubMed
    1. Baber J.L., Libutti, D., Levens, D. and Tjandra, N. (1999) High precision solution structure of the C-terminal KH domain of heterogeneous nuclear ribonucleoprotein K, a c-myc transcription factor. J. Mol. Biol., 18, 949–962. - PubMed
    1. Bazar L., Meighen, D., Harris, V., Duncan, R., Levens, D. and Avigan, M. (1995). Targeted melting and binding of a DNA regulatory element by a transactivator of c-myc. J. Biol. Chem., 270, 8241–8248. - PubMed