. 2000 Mar 1;19(5):1055-67.
doi: 10.1093/emboj/19.5.1055.

Transcription-dependent R-loop formation at mammalian class switch sequences

Affiliations

Transcription-dependent R-loop formation at mammalian class switch sequences

R B Tracy et al. EMBO J. .

Retraction in

Abstract

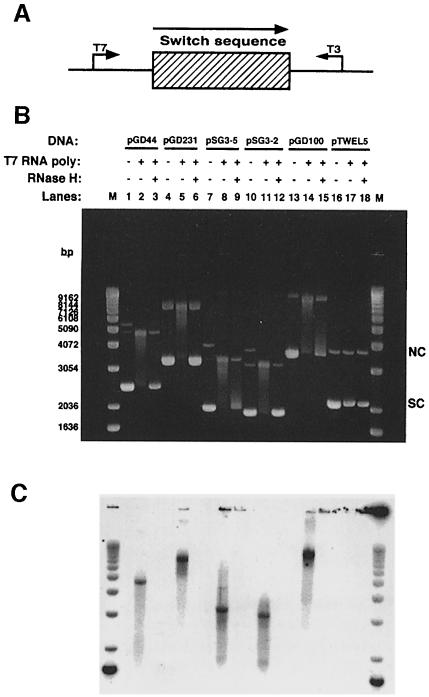
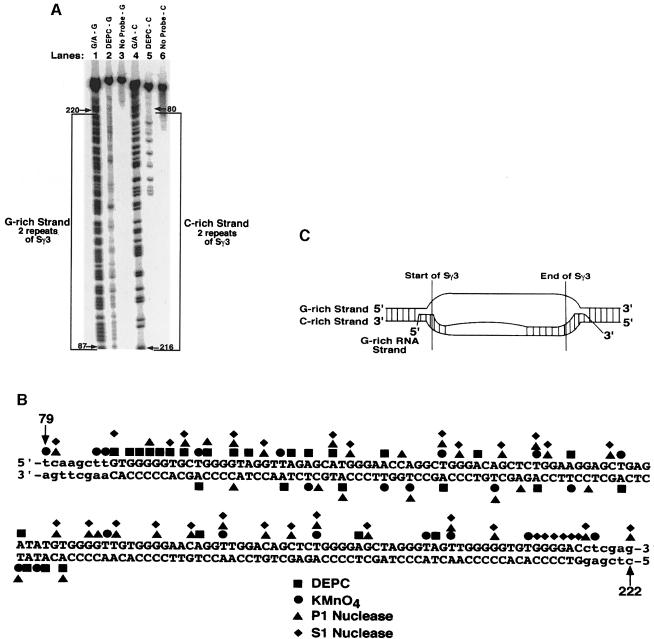
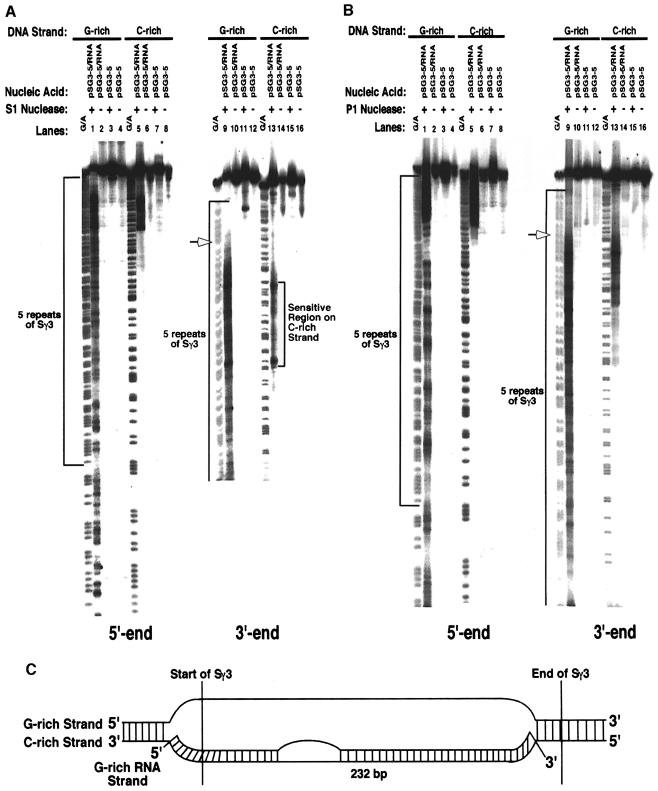
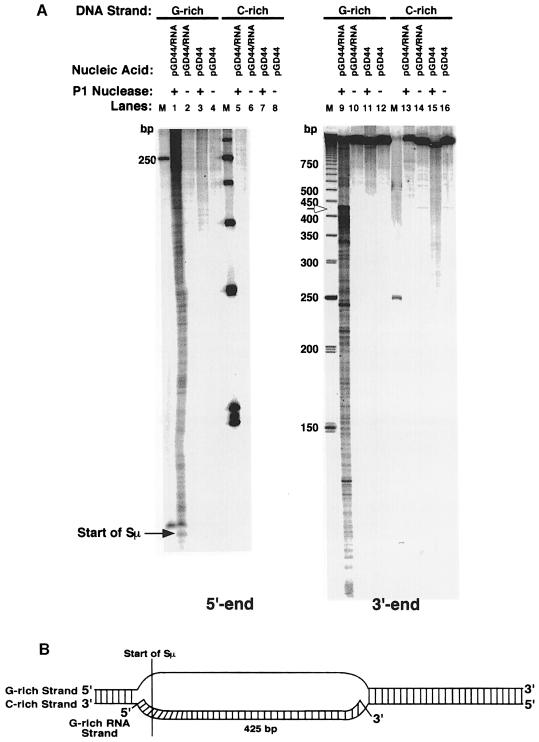
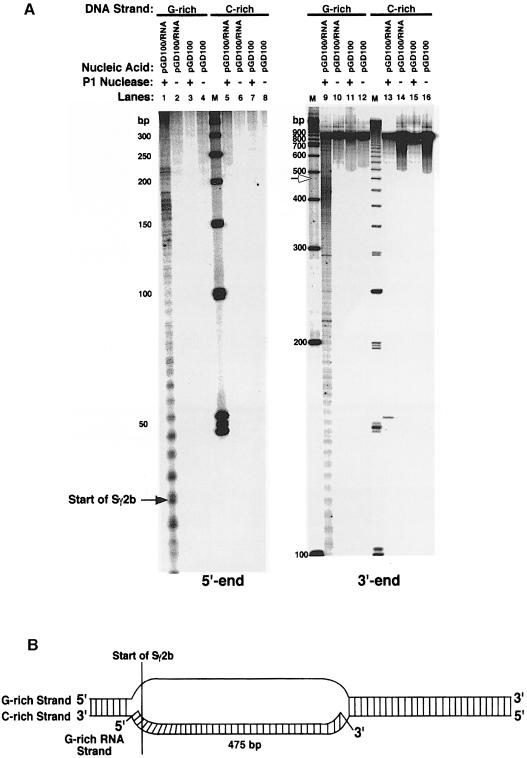
Immunoglobulin class switching is mediated by recombination between switch sequences located immediately upstream of the immunoglobulin constant heavy chain genes. Targeting of recombination to particular switch sequences is associated temporally with transcription through these regions. We recently have provided evidence for inducible and stable RNA-DNA hybrid formation at switch sequences in the mouse genome that are mechanistically important for class switching in vivo. Here, we define in vitro the precise configuration of the DNA and RNA strands within this hybrid structure at the Smicro, Sgamma3 and Sgamma2b mouse switch sequences. We find that the G-rich (non-template) DNA strand of each switch sequence is hypersensitive to probes throughout much of its length, while the C-rich (template) DNA strand is essentially resistant. These results demonstrate formation of an R-loop, whereby the G-rich RNA strand forms a stable heteroduplex with its C-rich DNA strand counterpart, and the G-rich DNA strand exists primarily in a single-stranded state. We propose that the organized structure of the R-loop is essential for targeting the class switch recombination machinery to these sequences.


Figures

None
Fig. 1. Altered DNA mobility upon in vitro transcription of murine class switch sequences Sμ, Sγ3 and Sγ2b. (A) Diagram of switch sequences on plasmids showing the direction of physiological transcription. The bent arrows indicate the direction of transcription by either T3 or T7 RNA polymerase. (B) Supercoiled plasmid DNA containing either a 900 bp fragment of Sμ (pGD44), a 2.2 kb fragment of Sγ3 (pGD231), a 267 bp fragment of Sγ3 (pSG3-5), a 129 bp fragment of Sγ3 (pSG3-2), an 832 bp fragment of Sγ2b (pGD100) or a 564 bp HindIII fragment from λ phage (pTWEL5) was transcribed, treated with RNase A, run out on a 1% agarose gel and post-stained with ethidium bromide as described in Materials and methods. Lanes 1, 4, 7, 10, 13 and 16 are non-transcribed plasmids; lanes 2, 5, 8, 11, 14 and 17 are plasmids transcribed with T7 RNA polymerase; lanes 3, 6, 9, 12, 15 and 18 are plasmids transcribed with T7 RNA polymerase and treated with RNase H. A 1 kb ladder (Gibco-BRL) was used as a molecular weight marker (M). The positions of supercoiled (SC) and nicked circular (NC) forms of the plasmids are indicated. (C) Radioactive image of the gel shown in (B).
None
Fig. 2. Fine mapping of the chemical and enzymatic hypersensitive sites on the G–rich and C–rich DNA strands within the R–loop formed at two repeats of Sγ3. (A) Sequencing gel showing the results of probing the G–rich and C–rich DNA strands within the R–loop formed at two repeats of Sγ3 on supercoiled pSG3-2 with DEPC (lanes 2 and 5, respectively), or the absence of probing (lanes 3 and 6, respectively). The positions of modification were determined by using a G + A sequencing ladder for each strand (lane 1 for the G–rich strand and lane 4 for the C–rich strand). The G–rich and C–rich strands are bracketed. (B) Summary of fine mapping with DEPC, KMnO4, P1 nuclease and S1 nuclease. Bases in upper case letters depict the G–rich (top) and the C–rich (bottom) strands of two repeats of Sγ3, whereas the lower case letters represent the vector sequence. (C) Structure of the RNA–DNA hybrid at the two repeats of Sγ3 as inferred from the fine mapping data. The boundaries of two repeats of Sγ3, and the configuration of the DNA and RNA strands are shown.
None
Fig. 3. S1 and P1 nuclease-hypersensitive sites on the G–rich and C–rich DNA strands within the R–loop formed at five repeats of Sγ3. (A) Sequencing gel displaying the S1 nuclease-hypersensitive sites on the G–rich (lanes 1–4 and 9–12) and C–rich (lanes 5–8 and 13–16) DNA strands at the five repeats of Sγ3 within the R–loop and on supercoiled plasmid pSG3-5. The left panel shows the hypersensitive sites for the entire five repeats. The right panel shows an expanded view of the 3′ end of the five repeats. Lanes 1, 5, 9 and 13 are R–loop samples that were probed with S1 nuclease; lanes 3, 7, 11, and 15 are supercoiled pSG3-5 samples probed with S1 nuclease; lanes 2, 6, 10 and 14 are R–loop samples that were not probed; lanes 4, 8, 12 and 16 are pSG3-5 samples that were not probed. The G + A sequencing ladders are indicated. The five repeats of Sγ3 are bracketed on the images. The open arrows indicate the boundary between the single- and double-stranded regions of the G–rich strand at the 3′ end. The arrows are placed at the position where the phosphorimager indicated the largest decrease in the intensity of the signal. (B) Sequencing gel showing the P1 nuclease-hypersensitive sites on the G–rich and C–rich DNA strands at the five repeats of Sγ3 within the R–loop and on supercoiled pSG3-5. See (A) for a description of these panels. (C) Putative structure of the R–loop at the five repeats of Sγ3 as determined from the S1 and P1 nuclease probing data.
None
Fig. 4. P1 nuclease-hypersensitive sites on the G–rich and C–rich DNA strands within the R–loop formed at a 900 bp fragment of the Sμ sequence. (A) Sequencing gel displaying the P1 nuclease-hypersensitive sites on the G–rich (lanes 1–4 and 9–12) and C–rich (lanes 5–8 and 13–16) DNA strands at Sμ within the R–loop and on supercoiled plasmid pGD44. The left panel shows the hypersensitive sites at the 5′ end of Sμ. The right panel shows the sites at the 3′ end. Lanes 1, 5, 9 and 13 are R–loop samples that were probed with P1 nuclease; lanes 3, 7, 11 and 15 are supercoiled pGD44 samples probed with P1 nuclease; lanes 2, 6, 10 and 14 are R–loop samples that were not probed; lanes 4, 8, 12 and 16 are pGD44 samples that were not probed. Ladders of 50 and 250 bp (Pharmacia) were used as standards. The start of Sμ is shown on the left panel. The boundary between the single- and double-stranded regions of the G–rich strand is indicated by the open arrow. (B) Putative model for the R–loop structure formed at a portion of the Sμ sequence as deduced from the P1 nuclease probing data. The hybrid does not extend to the end of the switch sequence for reasons explained in the text.
None
Fig. 5. Fine mapping of the P1 nuclease-hypersensitive sites on the G–rich and C–rich DNA strands within the R–loop formed at an 832 bp fragment of the Sγ2b sequence. (A) See legend of Figure 4 for description of gels. Ladders of 50 and 100 bp were used as standards. The start of Sγ2b is shown on the left panel. The border between the single-stranded and double-stranded regions of the G–rich strand is indicated by the open arrow. (B) Putative model for the R–loop structure formed at a portion of the Sγ2b sequence as inferred from the P1 nuclease probing data. In the text, we explain why the G–rich RNA strand only forms a stable hybrid with a portion of the C–rich (template) DNA strand.
None
Fig. 6. Two-dimensional gel analysis of RNA–DNA hybrid formation at Sγ3 on plasmid pGD231. The first dimension allows plasmids to be separated according to the absolute number of supercoils they contain, while the second dimension allows one to distinguish whether the supercoils are positive or negative in orientation (Wang et al., 1983). (A) Two-dimensional electrophoretic analysis of topo I-relaxed pGD231. The first dimension was performed in the presence of TBE buffer and the second dimension in the presence of TBE and 20 μM chloroquine. Nicked circular (NC) molecules, which move slowly in both dimensions, linear molecules and supercoiled (SC) molecules are indicated. The numbers correspond to the observed topoisomers in the plasmid. Under the chloroquine concentration used, the positively supercoiled topoisomers migrate in the right portion of the curve, whereas the negatively supercoiled topoisomers migrate in the left part of the curve. (B) Two-dimensional gel analysis of topo I-relaxed pGD231, which was transcribed previously.
None
Fig. 7. Extent of RNA hybridized to switch DNA sequences in the presence and absence of DNA gyrase. The RNA species were radiolabeled internally with [α–32P]UTP during RNA–DNA hybrid formation. Transcription was performed with supercoiled pGD44 (lanes 1–3), pGD231 (lanes 4–6), pSG3-2 (lanes 7–9) or pGD100 (lanes 10–12). pGD44 contains 900 bp of Sμ, pGD231 contains 2.2 kb of Sγ3, pSG3-2 contains 129 bp of Sγ3 and pGD100 contains 832 bp of Sγ2b. Lanes 1, 4, 7 and 10 are plasmids transcribed in the absence of DNA gyrase; lanes 2, 5, 8 and 11 are plasmids transcribed in the presence of DNA gyrase; lanes 3, 6, 9 and 12 are plasmids transcribed in the presence of DNA gyrase and then treated with RNase H. M designates a 1 kb ladder.

Comment in

  • Findings of scientific misconduct.
    [No authors listed] [No authors listed] NIH Guide Grants Contracts (Bethesda). 2002 May 30:NOT-OD-02-051. NIH Guide Grants Contracts (Bethesda). 2002. PMID: 12449911 Free PMC article. No abstract available.

Similar articles

Cited by

References

    1. Baker T.A. and Kornberg, A. (1988) Transcriptional activation of initiation of replication from the E.coli chromosomal origin: an RNA–DNA hybrid near oriC. Cell, 55, 113–123. - PubMed
    1. Bottaro A., Lansford, R., Xu, L., Zhang, J., Rothman, P. and Alt, F.W. (1994) S region transcription per se promotes basal IgE class switch recombination but additional factors regulate the efficiency of the process. EMBO J., 13, 665–674. - PMC - PubMed
    1. Carles-Kinch K. and Kreuzer, K.N. (1997) RNA–DNA hybrid formation at a bacteriophage T4 replication origin. J. Mol. Biol., 266, 915–926. - PubMed
    1. Casellas R., et al. (1998) Ku80 is required for immunoglobulin isotype switching. EMBO J., 17, 2404–2411. - PMC - PubMed
    1. Champoux J.J. and McConaughy, B.L. (1975) Priming of superhelical SV40 DNA by E.coli RNA polymerase for in vitro DNA synthesis. Biochemistry, 14, 307–316. - PubMed

Publication types