. 2000 Mar 1;523 Pt 2(Pt 2):339-51.
doi: 10.1111/j.1469-7793.2000.t01-2-00339.x.

Stoichiometry of Na+-Ca2+ exchange in inside-out patches excised from guinea-pig ventricular myocytes

Affiliations

Stoichiometry of Na+-Ca2+ exchange in inside-out patches excised from guinea-pig ventricular myocytes

Y Fujioka et al. J Physiol. .

Abstract

1. The stoichiometry (nx) of cardiac Na+-Ca2+ exchange was examined by measuring the reversal potential of the Na+-Ca2+ exchange current (INa-Ca) in large inside-out patches, 'macro patches', excised from intact guinea-pig ventricular cells. 2. Cytoplasmic application of Na+ (Na+i) or Ca2+ (Ca2+i) induced INa-Ca which showed properties similar to INa-Ca in the giant membrane patch. The outward INa-Ca was depressed by an exchanger inhibitory peptide, XIP. 3. The reversal potential of the XIP-sensitive current indicated that nx was approximately 4 (3.6-4.2) at 9-40 mM Na+i, and nx tended to increase as Na+i was increased. Proteolysis by trypsin did not significantly affect the stoichiometry. Similar results were obtained from the reversal potential of INa-Ca that was induced by application of both Na+i and Ca2+i. 4. At 0.1 microM Ca2+i, nx was approximately 4 (3.7-4. 4) at 6-25 mM Na+i and tended to increase as Na+i was increased. When Ca2+i was changed from 0.1 to 1 and 1000 microM at constant 50 mM Na+i, the value was approximately 4 (3.6-4.4). 5. When the extracellular Na+ (Na+o) and Ca2+ (Ca2+o) concentrations were varied in the presence of 25 or 9 mM Na+i and 1 microM Ca2+i, nx was almost constant ( approximately 4) over the range 0.3-20 mM Ca2+o and 10-145 mM Na+o. 6. These results indicated that the stoichiometry of Na+-Ca2+ exchange is different from generally accepted 3Na+:1Ca2+, and suggested that the stoichiometry is either 4Na+:1Ca2+ or variable depending on Na+i and Ca2+i.


Figures
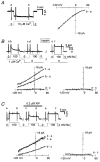
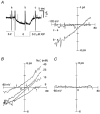
Figure 1
Figure 1. INa-Ca in the ‘macro patch’
A, 10 μM Ca2+i-induced inward INa-Ca. Na+0= 100 mM, Ca2+o= 0 mM, and Na+i= 0 mM. Ca2+i was increased from 0 to 10 μM during the period indicated. Right panel is the I–V relation of INa-Ca (‘b – a’), which was obtained as a difference current in the presence and absence of 10 μM Ca2+i. B, 100 mM Na+i-induced outward INa-Ca. Na+0= 0 mM and Ca2+o= 5 mM. Na+i (100 mM) was applied in the presence and absence of 1 μM Ca2+i. Then the cytoplasmic side of the patch was treated by trypsin for 20 s. The I–V relations in the presence (‘b – a’) and absence (‘d – c’) of 1 μM Ca2+i, and I–V relation after trypsin treatment (‘f – e’) were superimposed. Note that 1 μM Ca2+i did not affect background current (‘a – c’). C, inhibition of INa-Ca by XIP. The patch was pretreated with trypsin. XIP (0.2 μM) reversibly inhibited 100 mM Na+i-induced INa-Ca. Note that the effect of XIP on the background current was small (‘a – c’). Data in A, B and C were obtained from different patches.
Figure 2
Figure 2. XIP-sensitive INa-Ca
A, XIP-sensitive current. Na+0= 145 mM, Ca2+o= 2 mM, Na+i= 9 mM and Ca2+i= 1 μM. XIP (0.2 μM) suppressed inward INa-Ca at the holding potential (left panel) in the trypsin-treated patch. The XIP-sensitive current (‘b – a’) is shown in the right panel. Note that the background current did not significantly change (‘c – a’). B, I–V relation of the XIP-sensitive current at different Na+i. XIP (0.2 μM)-sensitive currents at 40, 25, 15 and 9 mM Na+i are shown. Dotted curves are fitting functions and arrows indicate reversal potentials. C, effect of XIP on the background current. XIP (0.2 μM)-sensitive current in the presence of 100 mM Na+i and 0 μM Ca2+i is shown (Na+0= 145 mM, Ca2+o= 2 mM, trypsin-untreated patch).
Figure 3
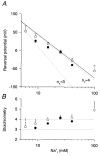
Figure 3. Reversal potentials and stoichiometry of the XIP-sensitive current
A, Na+i concentration-reversal potential relationship. Dotted lines indicate theoretical ENa-Ca of 4Na+:1Ca2+ and 3Na+:1Ca2+ exchange, respectively, and the continuous line is the fitted function (nx= 4.1). Data were obtained from trypsin-treated patches (^, 7 patches) and non-trypsin-treated patches (•, 6 patches). B, Na+i concentration- stoichiometry relationship. nx was calculated from the experimental data in A using eqn (2). Na+0= 145 mM, Ca2+o= 2 mM and Ca2+i= 1 μM. The number of values at each Na+i concentration was 3–7.
Figure 4
Figure 4. Na+i,Ca2+i-induced INa-Ca
A, INa-Ca induced by application of Na+i and Ca2+i. Na+0= 145 mM, Ca2+o= 2 mM. The patch was pretreated with trypsin. An application of 12 mM Na+i and 1 μM Ca2+i induced an inward INa-Ca at the holding potential (left panel). The I–V relation of the current (‘b – a’) is shown in the right panel. Note that background current did not change significantly after the activation of INa-Ca (‘c – a’). B, the I–V relation at different Na+i concentrations. The Na+i concentration was changed from 12 to 50 mM in a patch with the same protocol as A. C, 100 mM Na+i-induced current in the absence of both Na+0 and Ca2+o in the pipette solution. Na+0 was replaced by NMDG.
Figure 5
Figure 5. Reversal potentials and stoichiometry of the Na+i,Ca2+i-induced INa-Ca
A, Na+i concentration-reversal potential relationship. Dotted lines indicate theoretical ENa-Ca of 4Na+:1Ca2+ and 3Na+:1Ca2+ exchange, respectively, and the continuous line is the fitted function (nx= 4.3). Data were from trypsin-treated patches (□, 9 patches) and non-trypsin-treated patches (▪, 9 patches). B, Na+i concentration-stoichiometry relationship. nx was calculated from the data in A using eqn (2).
Figure 6
Figure 6. Ca2+i dependence of the reversal potential
All patches were pretreated with trypsin. Data were obtained from the 0.2 or 0.8 μM XIP-sensitive current (^) and from the Na+i,Ca2+i-induced current (□). The two dotted lines have the same meanings as in Fig. 5. A, Na+i concentration-reversal potential (upper panel) and -stoichiometry (lower panel) relationships at 0.1 μM Ca2+i. Na+0= 145 mM and Ca2+o= 2 mM. Data were from 6 patches. The continuous line is the fitted function (nx= 4.3). B, Ca2+i concentration-reversal potential (upper panel) and -stoichiometry (lower panel) relationships. Na+0= 145 mM, Ca2+o= 2 mM and Na+i= 50 mM. Data were from 7 patches. The continuous line is the fitted function (nx= 4.6).
Figure 7
Figure 7. Na+0 and Ca2+o concentration dependencies of the reversal potential
A, Ca2+o concentration-reversal potential (upper panel) and -stoichiometry (lower panel) relationships. Na+0= 145 mM, Na+i= 25 mM and Ca2+i= 1 μM. The fitted nx is 4.2 (continuous line). Data were from 17 patches. B, Na+0 concentration-reversal potential (upper panel) and -stoichiometry (lower panel) relationships. Ca2+o= 2 mM, Na+i= 9 mM and Ca2+i= 1 μM. The fitted nx is 4.3 (continuous line). Data were from 24 patches. All the data were obtained from the 0.2 μM XIP-sensitive current (^) and from the Na+i,Ca2+i-induced current (□) in trypsin-treated patches. In each case the two dotted lines have the same meanings as in Fig. 5.
Figure 8
Figure 8. Reversal potential of INa-Ca in the giant membrane patch from cardiac bleb
A, Na+i concentration-reversal potential relation. Na+0= 145 mM, Ca2+o= 2 mM and Ca2+i= 1 μM. Data were from the 0.2 μM XIP-sensitive current (^) and from the Na+i,Ca2+i-induced current (□). B, Na+i concentration- stoichiometry relation. In A and B the two dotted lines have the same meanings as in Fig. 5. The number of values at each point was 3–5.
Figure 9
Figure 9. Simulation of ion flux in the inside-out patch
A, activation of outward INa-Ca. The pipette solution contains 0 mM Na+0 and 5 mM Ca2+o. The patch was pretreated with trypsin. Na+i (50 mM)-induced INa-Ca and simulated INa-Ca with the patch distance of 4, 6, 8 and 10 μm (smooth curves from left to right) are superimposed. B, suppression of outward INa-Ca by Ca2+i. Ca2+ (2 mM: 10 mM EGTA + 12 mM CaCl2) inhibited the 50 mM Na+-induced INa-Ca. Simulated INa-Ca with the patch distance of 4, 6, 8 and 10 μm (smooth curves from left to right) are also superimposed. C, open-tip response. Current response to bath solution change from the control Tyrode solution to 20 % diluted Tyrode solution was recorded after disruption of the patch membrane. Data from A, B and C were from the same pipette. D, simulation of INa-Ca, and Na+ and Ca2+ concentrations in a compartment just under the membrane. Na+ (50 mM) and Ca2+ (1 μM) were added at the bulk cytoplasmic space at time 0. INa-Ca had an Imax of 10 pA (upper panel). Na+ simulation in the middle panel had Imax values of 10 pA, 10 nA and 10 μA, and the results are superimposed (a, b and c). Ca2+ simulation in the bottom panel had Imax values of 10 pA (a), 10 nA (b) and 10 μA (c).

References

    1. Axelsen PH, Bridge JHB. Electrochemical ion gradients and the Na/Ca exchange stoichiometry. Measurements of these gradients are thermodynamically consistent with a stoichiometric coefficient > 3. Journal of General Physiology. 1985;85:471–475. - PMC - PubMed
    1. Bers DM, Patton CW, Nuccitelli R. A practical guide to the preparation of Ca2+ buffers. Methods in Cell Biology. 1994;40:3–29. - PubMed
    1. Blostein R, Polvani C. Proton transport, charge transfer, and variable stoichiometry of the Na, K-ATPase. Society of General Physiologists Series. 1991;46:289–301. - PubMed
    1. Candia OA, Cook P. Na+-K+ pump stoichiometry and basolateral membrane permeability of frog corneal epithelium. American Journal of Physiology. 1986;250:F850–859. - PubMed
    1. Chin TK, Spitzer KW, Philipson KD, Bridge JHB. The effect of exchanger inhibitory peptide (XIP) on sodium-calcium exchange current in guinea pig ventricular cells. Circulation Research. 1993;72:497–503. - PubMed

Publication types

MeSH terms

LinkOut - more resources