. 2000 Mar 1;523 Pt 2(Pt 2):353-66.
doi: 10.1111/j.1469-7793.2000.t01-1-00353.x.

Paradoxical block of the Na+-Ca2+ exchanger by extracellular protons in guinea-pig ventricular myocytes

Affiliations

Paradoxical block of the Na+-Ca2+ exchanger by extracellular protons in guinea-pig ventricular myocytes

M Egger et al. J Physiol. .

Abstract

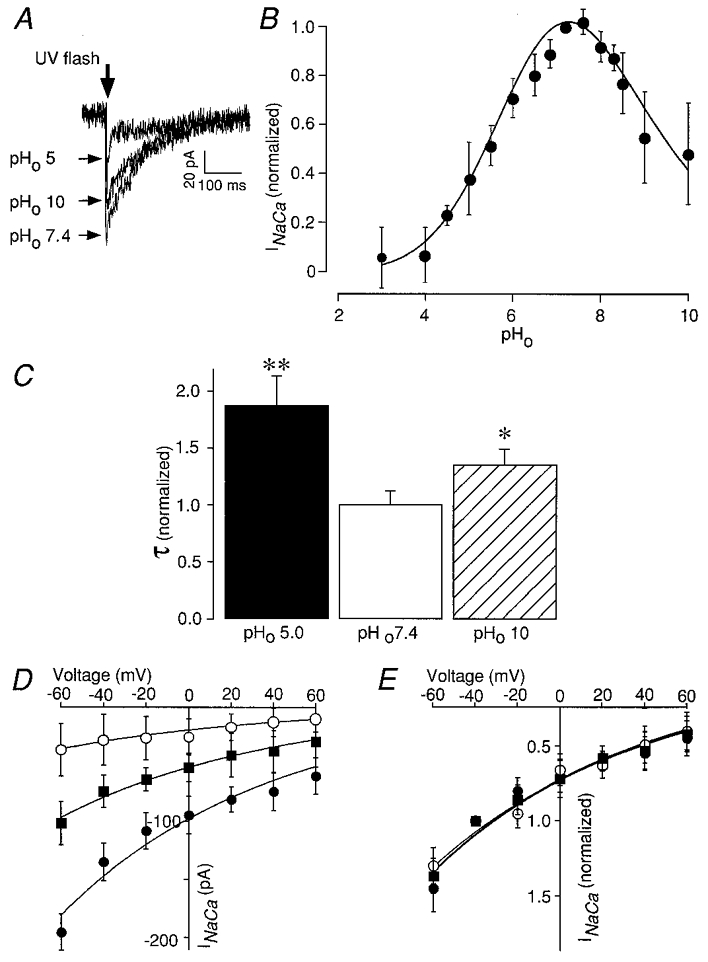
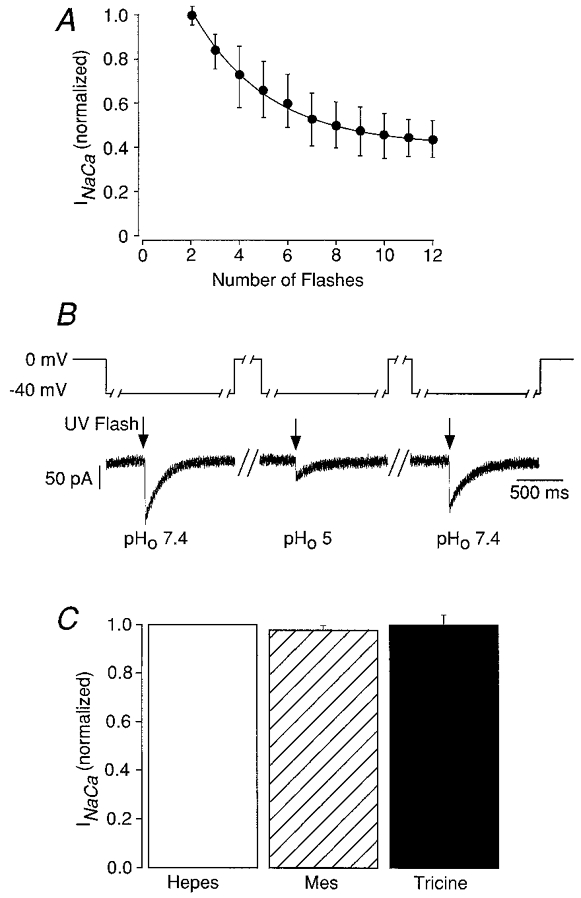
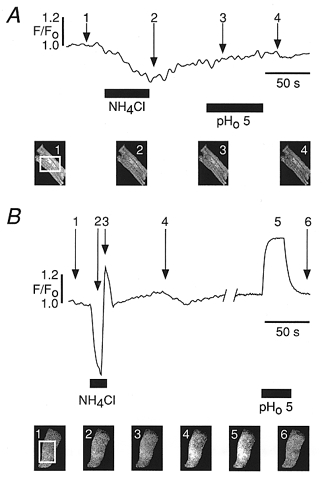
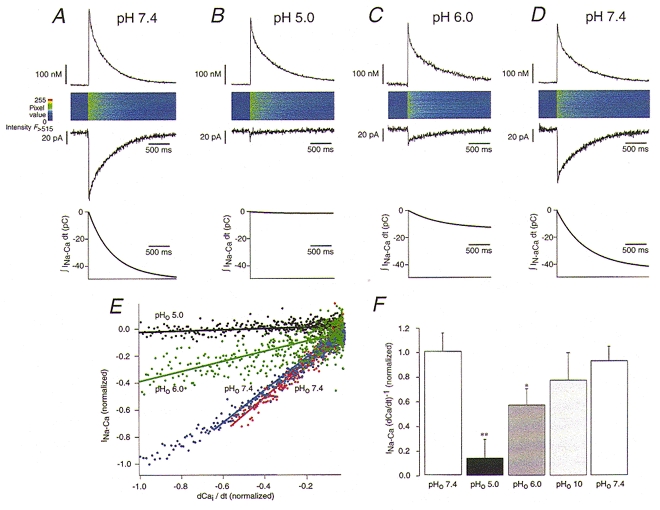
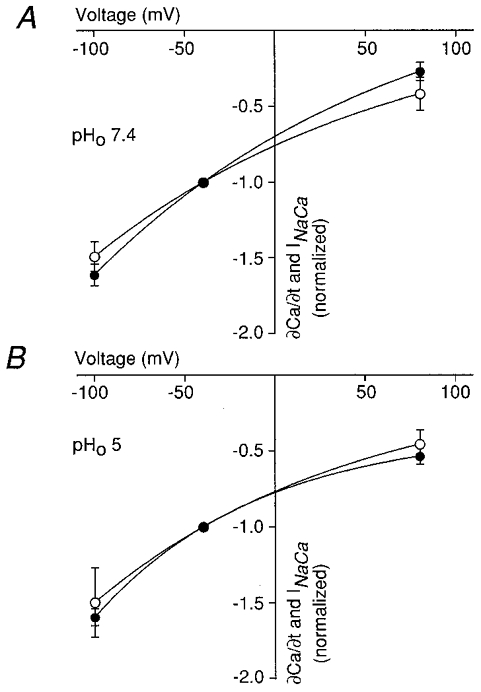
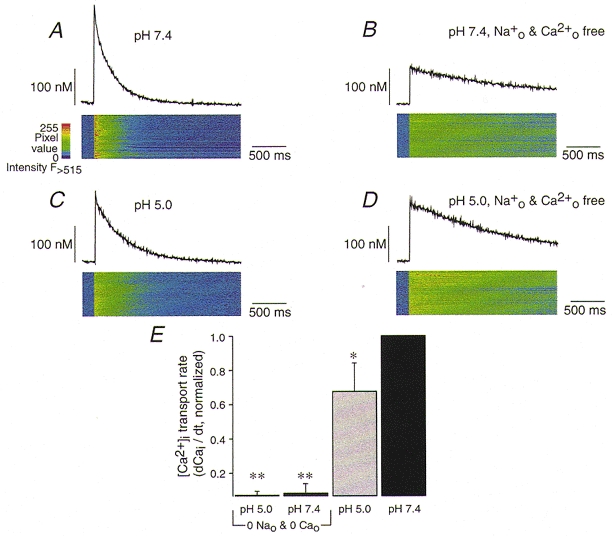
1. The Na+-Ca2+ exchange is a major pathway for removal of cytosolic Ca2+ in cardiac myocytes. It is known to be inhibited by changes of intracellular pH that may occur, for example, during ischaemia. In the present study, we examined whether extracellular protons (pHo) can also affect the cardiac exchange. 2. Na+-Ca2+ exchange currents (INa-Ca) were recorded from single adult guinea-pig ventricular myocytes in the whole-cell voltage-clamp configuration while [Ca2+]i was simultaneously imaged with fluo-3 and a laser-scanning confocal microscope. To activate INa-Ca, intracellular Ca2+ concentration jumps were generated by laser flash photolysis of caged Ca2+ (DM-nitrophen). 3. Exposure of the cell to moderately and extremely acidic conditions (pHo 6 and 4) was accompanied by a decrease of the peak INa-Ca to 70 % and less than 10 %, respectively. The peak INa-Ca was also inhibited to about 45 % of its initial value by increasing pHo to 10. The largest INa-Ca was found at pHo approximately 7.6. 4. Simultaneous measurements of [Ca2+]i and INa-Ca during partial proton block of the Na+-Ca2+ exchanger revealed that the exchange current was more inhibited by acidic pHo than the rate of Ca2+ transport. This observation is consistent with a change in the electrogenicity of the Na+-Ca2+ exchange cycle after protonation of the transporter. 5. We conclude that both extracellular alkalinization and acidification affect the Na+-Ca2+ exchanger during changes of pHo that may be present under pathophysiological conditions. During both extreme acidification or alkalinization the Na+-Ca2+ exchanger is strongly inhibited, suggesting that extracellular protons may interact with the Na+-Ca2+ exchanger at multiple sites. In addition, the electrogenicity and stoichiometry of the Na+-Ca2+ exchange may be modified by extracellular protons.


Figures

Figure 1
Figure 1. Inhibition of the Na+-Ca2+ exchanger by alterations of pHo
A, three examples of Na+-Ca2+ exchange currents (INa-Ca) induced by flash photolysis of DM-nitrophen (2 mM) and recorded in acidic (pHo 5), alkaline (pHo 10) and neutral (pHo 7.4) extracellular solution. All experiments were carried out in the presence of 10 μM ryanodine and 0.1 μM thapsigargin. B, the bell-shaped curve reveals that pHo extremes can inhibit the peak INa-Ca. The INa-Ca peak amplitude was determined from the mean of five data points around the most negative sample in the current record and normalized at Vm=−40 mV and pHo 7.4 after correction for photoconsumption (see Fig. 2B). Reducing the pHo was accompanied by a decrease of the peak INa-Ca to less than 7 % (pH 4–5). The peak INa-Ca was also inhibited to about 48 % of its initial value by increasing pHo to 10. The data were fitted using two Hill equations describing the pHo range with the following parameters: Bars represent mean ±s.e.m. (n= 5–10). C, pHo effects on INa-Ca time course. The time constants were determined by fitting a monoexponential function to INa-Ca with a least-squares technique. Occasionally, a rapid current component not arising from INa-Ca was observed (Fig. 1A). The rapid INa-Ca component was not used for analysis and fitting. The Na+-Ca2+ exchange current decay was slowed at high and low pHo. The graph represents τ normalized for pHo 7.4. Acidification (pHo 5.0) and alkalinization (pHo 10.0) increased τ significantly (pHo 5.0: τ= 863 ± 123 ms; pHo 7.4: τ= 459 ± 54 ms; pHo 10.0: τ= 620 ± 64 ms). Error bars represent mean ±s.e.m. (n= 6). *P < 0.05 vs. pHo 7.4 and **P < 0.001 vs. pHo 7.4. D, voltage dependence of INa-Ca induced by concentration jumps of [Ca2+]i at pHo 7.4, pHo 5 and pHo 10. The amplitude of the peak INa-Ca inward current shows a tendency to increase with more negative potentials independent of the pHo. However, at pHo 5 the INa-Ca-V relationship deviates at potentials below −20 mV and the INa-Ca appears to saturate. The lines represent non-linear least-squares fits of the Di Francesco-Noble model:(Di Francesco & Noble, 1985), where a is a scaling factor determining the magnitude of INa-Ca and r represents the asymmetrical position of the energy barrier inside the electrical field of the sarcolemmal membrane. pH 7.4 (•): a=−0.36 × 10³, r= 0.73; pH 5.0 (^): a=−7.8 × 10⁻⁵, r= 0.75; pH 10 (▪): a=−1.89 × 10⁻⁴, r= 0.74. Error bars represent mean ±s.e.m. (n= 8). E, normalized voltage dependence of the peak INa-Ca. At pHo 5 and pHo 10, the normalized INa-Ca-V curve is superimposable on the control curve. Currents are normalized with respect to the current elicited at −40 mV (mean ±s.e.m., n= 8).
Figure 2
Figure 2. Experimental protocol, photoconsumption and pH-buffer effects on INa-Ca
A, INa-Ca peak inward currents were induced by repeatedly applying 230 W flashes at a holding potential of −40 mV. Error bars represent mean ±s.e.m. (n= 5–12). The photoconsumption of DM-nitrophen was accompanied by decreasing peak INa-Ca and the experimental data can be fitted with a monoexponential function. B, this protocol was used to correct INa-Ca for the photoconsumption of DM-nitrophen. For data analysis and normalization, each test flash at each pHo was bracketed by two control flashes at −40 mV in pHo 7.4. The correction for photoconsumption was performed by normalization to a value determined by linear interpolation between two adjacent control values. A flash (indicated by arrow) was triggered 2 s after the voltage step, which was maintained for an additional 1 s. Unless indicated otherwise the INa-Ca measurements themselves were performed after repolarizing to −40 mV. Except for 2–4 s before the flash where the cells were superfused with the test solution, the myocytes were continuously superfused with the control solution (pH 7.4). C, no stimulation or inhibition of INa-Ca was observed by Hepes, Mes or Tricine at pH 7.4. Bars represent mean ±s.e.m. (n= 7).
Figure 3
Figure 3. Changes of pHi recorded with carboxy-SNARF-1
A, confocal fluorescence trace of a strongly pH-buffered adult guinea-pig myocyte in whole-cell configuration pre-loaded by exposure to 5 μM carboxy-SNARF-1-AM. The pipette solution contained 20 mM Hepes, identical to all other experiments. No substantial change of the fluorescence intensity during the superfusion step with pH 5 solution was observed. B, confocal fluorescence measurement using carboxy-SNARF-1-AM (loading with 5 μM for 60 min, room temperature) in neonatal rat myocytes. Superfusion with 10 mM NH4Cl to induce an acid load induced the fluorescence response characteristic for the NH4+ prepulse method (Buckler & Vaughan-Jones, 1990). Superfusion with pHo 5 induced an increase of the carboxy-SNARF-1 fluorescence. Snapshot images (1–4 in A and 1–6 in B) were taken at different times during each superfusion step, indicated by arrows.
Figure 4
Figure 4. The electrogenicity and Ca2+ transport rate of the Na+-Ca2+ exchanger in acidic pH
Comparison of INa-Ca and Ca2+ transport in response to flash photolysis of caged Ca2+ in pHo 7.4 (A, initial control), pHo 5 (B), pHo 6 (C) and pHo 7.4 (D, re-control at end). Traces show from top to bottom: [Ca2+]i transients, line scan images of fluo-3 fluorescence, the corresponding INa-Ca traces (Vm=−50 mV) and the transported charge (∫INa-Cadt: pH 7 = 48.5 pC, pH 5 = 1.5 pC, pH 6 = 12.6 pC, pH 7 = 41.9 pC) measured in a single ventricular myocyte. In E, INa-Ca is plotted as a function of the Ca2+ transport rate (differentiated [Ca2+]i signal, dCa2+i/dt) calculated from the data presented in A–D (control: red dots; re-control at end: blue dots; pHo 6: green dots; pHo 5: black dots). The data were normalized to the maximal INa-Ca at pH 7.4 and the corresponding maximal Ca2+ transport rate. The lines represent linear fits of the experimental data (slopes: pHo 5 = 0.058, pHo 6 = 0.036, pHo 7.4start= 1.04, pHo 7.4end= 1.30). Acidification (pHo 5 and pHo 6) inhibited INa-Ca to a larger extent than the Ca2+ transport rate (compare A and B), leading to a change in the slope. In F charge movement per transported Ca2+ is expressed as INa-Ca/(dCa2+/dt) normalized for pH 7.4. Results are summarized for initial control (white bar), pHo 5 (black bar), pHo 6 (dark grey bar), pHo 10 (light grey bar) and final control at pHo 7.4 (white bar). Under extreme acidic conditions (pHo 5 and pHo 6) INa-Ca/(dCa2+/dt) was significantly reduced. Error bars represent mean ±s.e.m. (n= 6). *P < 0.05 vs. pHo 7.4 and **P < 0.001 vs. pHo 7.4.
Figure 5
Figure 5. Voltage dependence of the Ca2+ transport rate and of the peak INa-Ca
A, normalized Ca2+ transport rate (d[Ca2+]i/dt; •) and normalized INa-Ca (^) as a function of voltage at pH 7.4 and in B at pH 5. The experimental data can be fitted with a monoexponential function. Error bars represent mean ±s.e.m. (n= 3). Hyperpolarization increased both INa-Ca and Ca2+ transport rate comparably.
Figure 6
Figure 6. Ca2+ transport by the Na+-Ca2+ exchanger in low pH and zero Na+
Ca2+ extrusion via the Na+-Ca2+ exchanger was blocked by omitting Na+ and Ca2+ from the superfusing solution. Traces in A–D show from top to bottom: [Ca2+]i transients and the corresponding line scan images of fluo-3 fluorescence in pHo 7.4 (A) and pHo 5 (C), and under Na+0- and Ca2+o-free conditions: pHo 7.4 (B) and pHo 5 (D) measured in a single ventricular myocyte. In E, the Ca2+ transport rate (dCai/dt) was calculated and normalized for the maximal rate at pHo 7.4. Note that in the absence of Na+ no acceleration of Ca2+ transport by pH 5 was observed. Error bars represent mean ±s.e.m. (n= 6). *P < 0.05 vs. pHo 7.4 and **P < 0.001 vs. pHo 7.4.

Similar articles

Cited by

References

    1. Baazov D, Wang X, Khananshvili D. Time-resolved monitoring of electrogenic Na+-Ca2+ exchange in isolated cardiac sarcolemmal vesicles by using rapid-response fluorescence probe. Biochemistry. 1999;38:1435–1445. - PubMed
    1. Baker PF, Macnaughton PA. Selective inhibition of the Ca-dependent Na efflux from intact squid axons by a fall in intracellular pH. The Journal of Physiology. 1977;269:78–79P. - PubMed
    1. Barry WH, Bridge JH. Intracellular calcium homeostasis in cardiac myocytes. Circulation. 1993;87:1806–1815. - PubMed
    1. Bassani RA, Bassani JWM, Bers DM. Relaxation in ferret ventricular myocytes: unusual interplay among calcium transport systems. The Journal of Physiology. 1994;476:295–308. - PMC - PubMed
    1. Bassani RA, Bassani JWM, Bers DM. Relaxation in ferret ventricular myocytes: role of the sarcolemmal Ca-ATPase. Pflügers Archiv. 1995;430:573–578. - PubMed

Publication types

MeSH terms

LinkOut - more resources