. 2000 Mar 3;86(4):448-55.
doi: 10.1161/01.res.86.4.448.

Ca(2+) transients and Ca(2+) waves in purkinje cells : role in action potential initiation

Affiliations

Ca(2+) transients and Ca(2+) waves in purkinje cells : role in action potential initiation

P A Boyden et al. Circ Res. .

Abstract

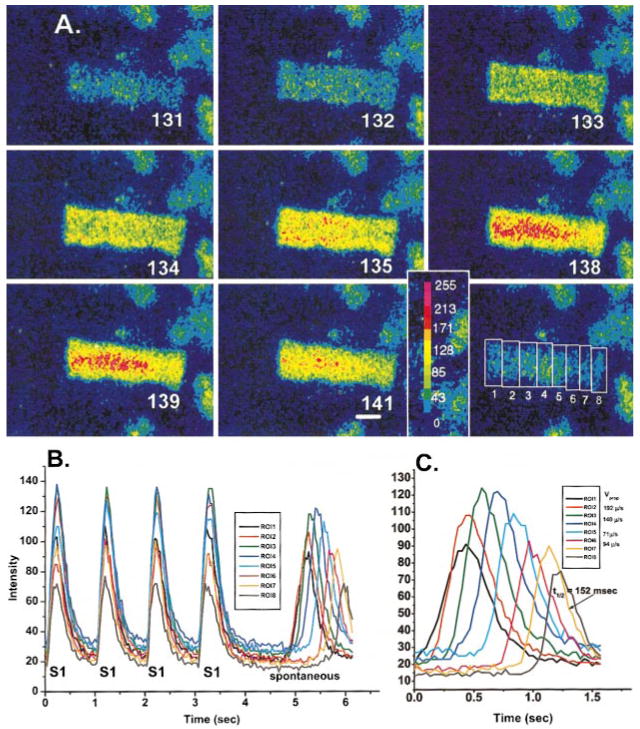
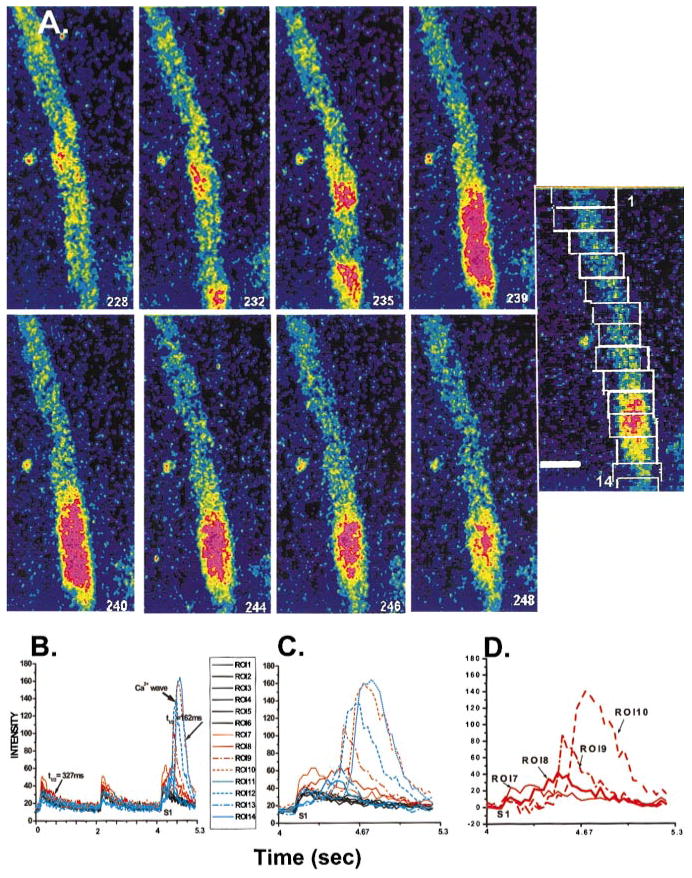
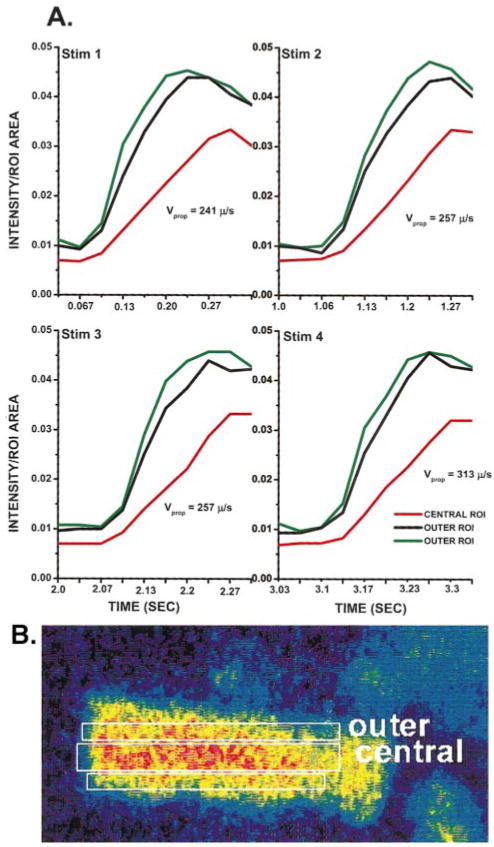
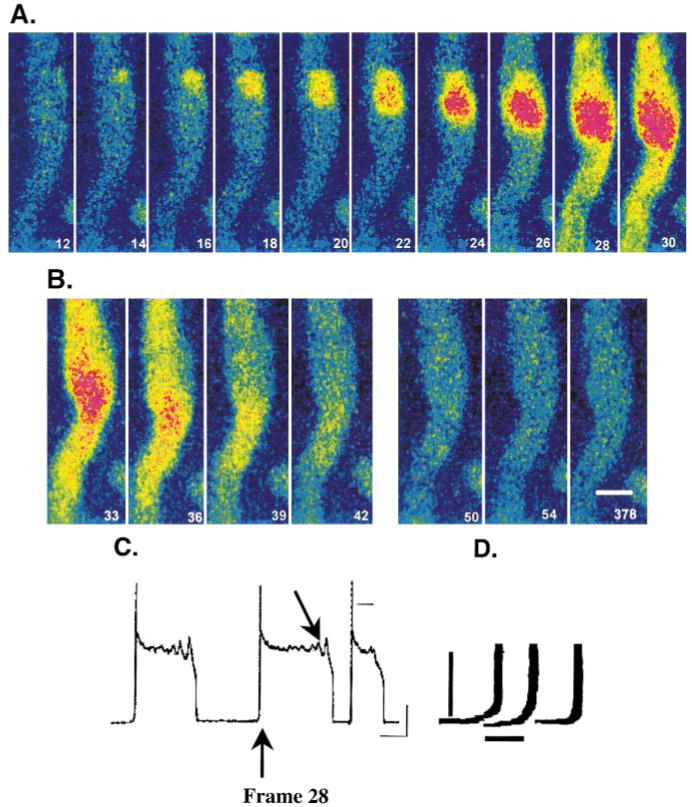
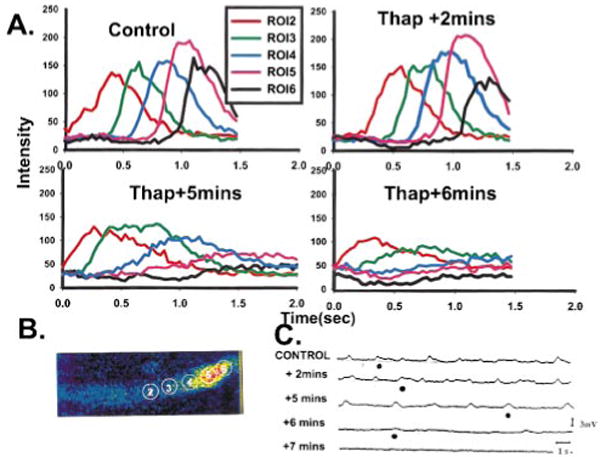
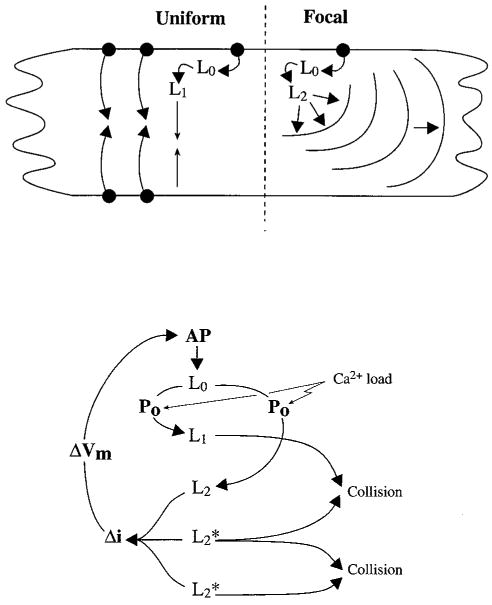
Purkinje cells contain sarcoplasmic reticulum (SR) directly under the surface membrane, are devoid of t-tubuli, and are packed with myofibrils surrounded by central SR. Several studies have reported that electrical excitation induces a biphasic Ca(2+) transient in Purkinje fiber bundles. We determined the nature of the biphasic Ca(2+) transient in aggregates of Purkinje cells. Aggregates (n=12) were dispersed from the subendocardial Purkinje fiber network of normal canine left ventricle, loaded with Fluo-3/AM, and studied in normal Tyrode's solution (24 degrees C). Membrane action potentials were recorded with fine-tipped microelectrodes, and spatial and temporal changes in [Ca(2+)](i) were obtained from fluorescent images with an epifluorescent microscope (x20; Nikon). Electrical stimulation elicited an action potential as well as a sudden increase in fluorescence (L(0)) compared with resting levels. This was followed by a further increase in fluorescence (L(1)) along the edges of the cells. Fluorescence then progressed toward the Purkinje cell core (velocity of propagation 180 to 313 microm/s). In 62% of the aggregates, initial fluorescent changes of L(0) were followed by focally arising Ca(2+) waves (L(2)), which propagated at 158+/-14 microm/s (n=13). Spontaneous Ca(2+) waves (L(2)*) propagated like L(2) (164+/-10 microm/s) occurred between stimuli and caused slow membrane depolarization; 28% of L(2)* elicited action potentials. Both spontaneous Ca(2+) wave propagation and resulting membrane depolarization were thapsigargin sensitive. Early afterdepolarizations were not accompanied by Ca(2+) waves. Action potentials in Purkinje aggregates induced a rapid rise of Ca(2+) through I(CaL) and release from a subsarcolemmal compartment (L(0)). Ca(2+) release during L(0) either induced further Ca(2+) release, which propagated toward the cell core (L(1)), or initiated Ca(2+) release from small regions and caused L(2) Ca(2+) waves, which propagated throughout the aggregate. Spontaneous Ca(2+) waves (L(2)*) induce action potentials.


Figures

Figure 1
Figure 1
A, Selected image frames from a sequence of frames of a Purkinje cell aggregate during extracellular stimulation (S1) at 1-second cycle length. Change in intensity of fluorescent signal is depicted by color change as shown in color bar (bottom right). Numbers indicate individual frame numbers. Bottom right, position of the various ROIs measured and plotted in B. Calibration bar=27 μm. B, Change in intensity of fluorescence at various ROIs during 4 S1 and after a pause and during a period of nonstimulation. Note the occurrence of a spontaneous Ca2+ wave (see text for more detail). Frames illustrated in A are taken from the first S1. C, Spontaneous Ca2+ wave of B on an expanded time scale. Inset, Measured Vprop of the Ca2+ wave between various ROI pairs. T1/2 refers to measured time to half-relaxation of Ca2+ transient at ROI 7. Note the striking uniformity of propagation of the Ca2+ wave in this aggregate. For movie forms of figures, a Web site is available at www.cvr.ucalgary.ca/slideshow.
Figure 2
Figure 2
A, Selected image frames of a Purkinje cell aggregate during the last of a train of stimuli (S1) seen in B. Note that during L0 in isolation (see text), small focal areas of Ca2+ increase at 2 separate foci within aggregate (frame 232). Each focus gives rise to a Ca2+ wave that propagates along the aggregate but in opposite directions. By frame 239, the 2 Ca2+ waves have merged (collided) but did not summate. Reuptake of Ca2+ at the site of the collision occurs over the next several frames. The image to the right indicates the position of 1 to 14 ROIs (top box is ROI 1). Borders of ROIs have been retouched for clarity. Calibration bar=52.5 μm. B, Change in intensity of fluorescence at 14 ROIs indicated in A. Images are from tracings of S1 indicated. T1/2 values indicated are time to half-relaxation of Ca2+i transient that is predominately L0 (327 ms) and L2* (162 ms). C, Changes in intensity of fluorescence at all ROIs during S1 indicated in B. Note that L0 in isolation is most visible in ROIs 1 to 6. Note also that Ca2+i changes occurring at ROI 7 precede the Ca2+ wave event depicted in A. D, ROIs 7 to 10 difference transients (obtained by subtracting average L0 Ca2+i change from original tracings) clearly show that focal Ca2+i change at ROI 7 occurs within 61 ms after the onset of L0 and precedes (initiates) the Ca2+i change at ROI 8, leading to the Ca2+ wave shown in B (as seen in ROIs 9 and 10).
Figure 3
Figure 3
Vprop in transverse direction (from cell outer edge to central cell area) of Ca2+ wave of Figure 1 was determined with an ROI configuration on the aggregate as shown in B. A, Time course of the ROI transients obtained for each of the extracellular stimuli (stim) shown in Figure 1B. Note that Ca2+i transients of outer ROIs (green and black) rise before central ROIs (red). Vprop calculated from midpoint of transients of outer to central ROIs is indicated for each stimulus.
Figure 4
Figure 4
A, Selected image frames of a Purkinje aggregate where small focal change in Ca2+ (frame 14) initiates a synchronized rise of Ca2+i (frame 28). An action potential also resulted at this time (C). As before, the frame number is arbitrary but in sequence. B, Selected image frames (frames 33 to 42) of the same aggregate immediately after the initiation of the action potential showing no Ca2+ wave. Also, selected image frames obtained later during the repolarization phase of the action potential where early afterdepolarizations were present (C) clearly show that propagating Ca2+ waves were absent. Calibration bar=18 μm. C, Transmembrane recordings made with fine-tipped microelectrode of aggregate before, during, and after images depicted in A and B. Note the upstroke of a nondriven action potential occurs during frame 28, and early afterdepolarizations occur during time course of frames 50, 54, and 378 (arrow). Resting potential of this nonstimulated aggregate was −82 mV (4 mmol/L Ko, 2 mmol/L Cao, 24°C). Calibration bars=5 seconds and 20 mV, respectively. Zero potential is indicated by small black line. D, Magnification of upstrokes of the 3 spontaneously occurring action potentials recorded from this aggregate and shown in C. The middle upstroke corresponds to action potential elicited at frame 28 (arrow) by Ca2+ wave of A. Voltage recordings have been retouched for presentation purposes. Calibration bars=1 second and 10 mV.
Figure 5
Figure 5
Effects of thapsigargin on changes in membrane potential and fluorescence at 5 ROIs during a propagating Ca2+ wave in a Purkinje aggregate. A, With thapsigargin, there is a reduction in the amplitude of Ca2+i transients as well as decremental conduction of Ca2+ waves (images not shown). B, Selected image of aggregate during control, drug-free period showing a Ca2+ wave and placement of the 5 ROIs depicted in A. C, Transmembrane potential recordings of this aggregate in the absence and presence of thapsigargin. Small depolarizations in membrane potential evident in control were inhibited with thapsigargin. ●, Occurrence of the Ca2+ wave illustrated in A and the time at which data were analyzed for plots of A.
Figure 6
Figure 6
Schematics illustrating the various components of Ca2+ movement in a Purkinje cell/aggregate during uniform action potential–evoked Ca2+ release and Ca2+ waves. Top, Action potential (black dot) Ca2+ entry and release (L0) can give rise to L1, which propagates to the cell core. In some aggregates, focal Ca2+ release that usually appears at a cell border can give rise to a propagating Ca2+ wave (L2). Bottom, Relationship between cell excitability and the various Ca2+ compartments of a Purkinje aggregate. AP indicates action potential; Po probability of wave generation; i, ionic current, and Vm, transmembrane voltage.

Similar articles

Cited by

References

    1. Wier WG, Isenberg G. Intracellular Ca transients in voltage clamped cardiac Purkinje fibers. Pflugers Arch. 1982;392:284–290. - PubMed
    1. Boyden PA, Albala A, Dresdner K. Electrophysiology and ultrastructure of canine subendocardial Purkinje cells isolated from control and 24 hour infarcted hearts. Circ Res. 1989;65:955–970. - PubMed
    1. Sommer JR, Johnson EA. Cardiac muscle: a comparative study of Purkinje fibers and ventricular fibers. J Cell Biol. 1968;36:497–526. - PMC - PubMed
    1. Hatem SN, Benardeau A, Rucker-Martin C, Marty I, de Chamisso P, Villaz M, Mercadier JJ. Different compartments of sarcoplasmic reticulum participate in the excitation-contraction coupling process in human atrial myocytes. Circ Res. 1997;80:345–353. - PubMed
    1. Huser J, Lipsius SL, Blatter LA. Calcium gradients during excitation-contraction coupling in cat atrial myocytes. J Physiol. 1996;494(3):641–651. - PMC - PubMed

Publication types