. 2000 Mar 6;191(5):771-80.
doi: 10.1084/jem.191.5.771.

Reversible defects in natural killer and memory CD8 T cell lineages in interleukin 15-deficient mice

Affiliations

Reversible defects in natural killer and memory CD8 T cell lineages in interleukin 15-deficient mice

M K Kennedy et al. J Exp Med. .

Abstract

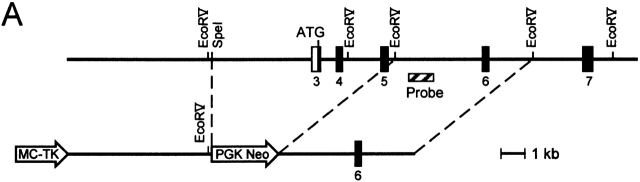
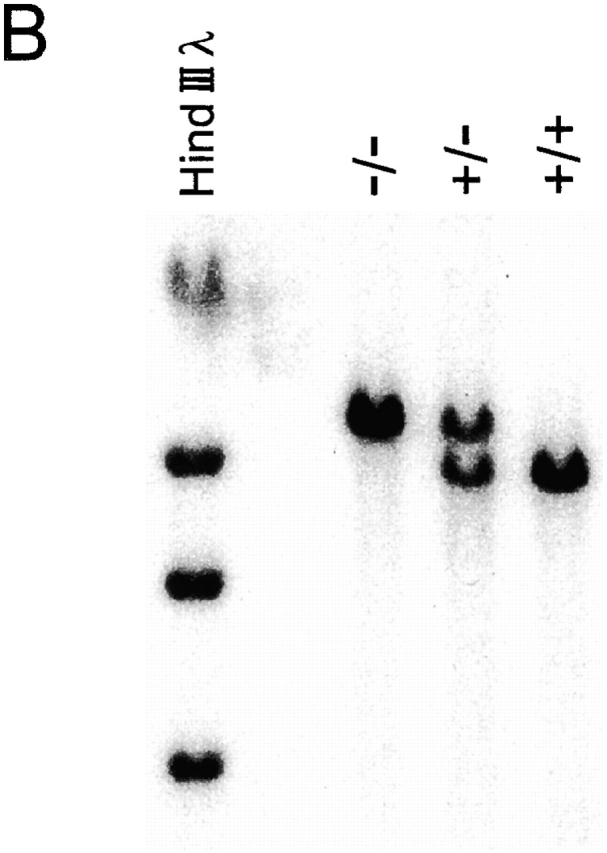
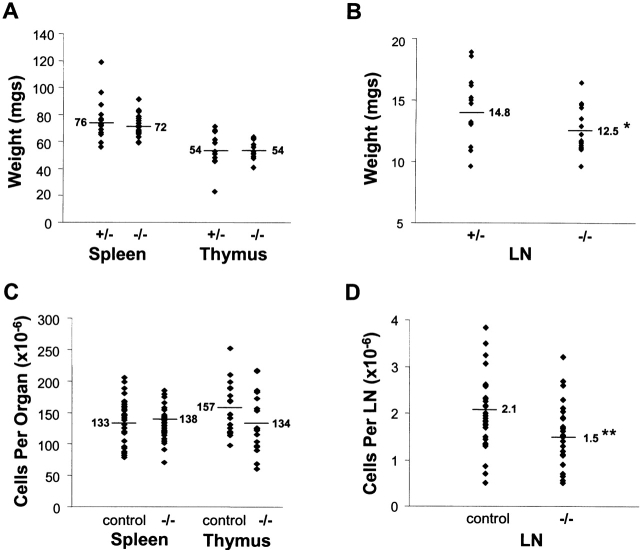
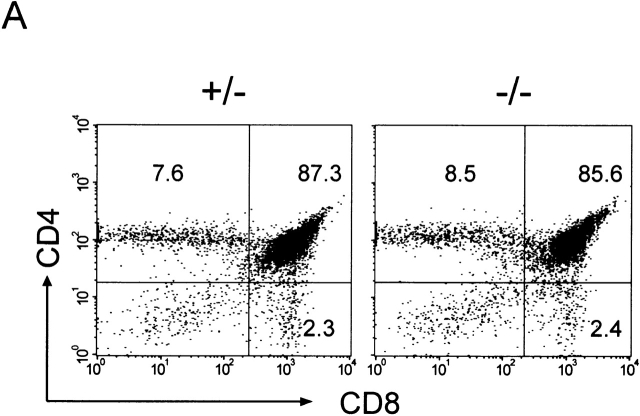
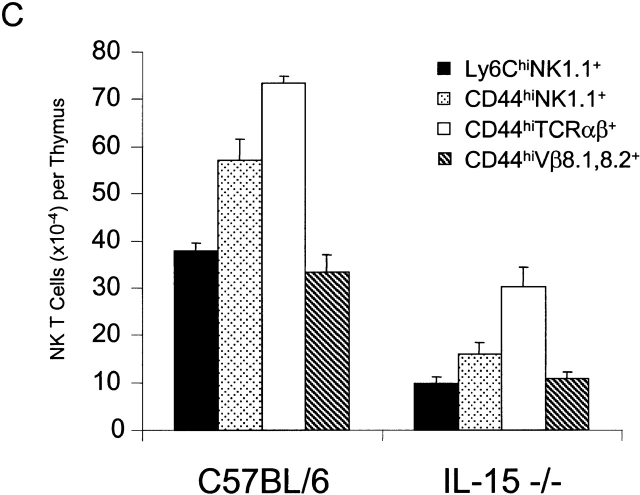
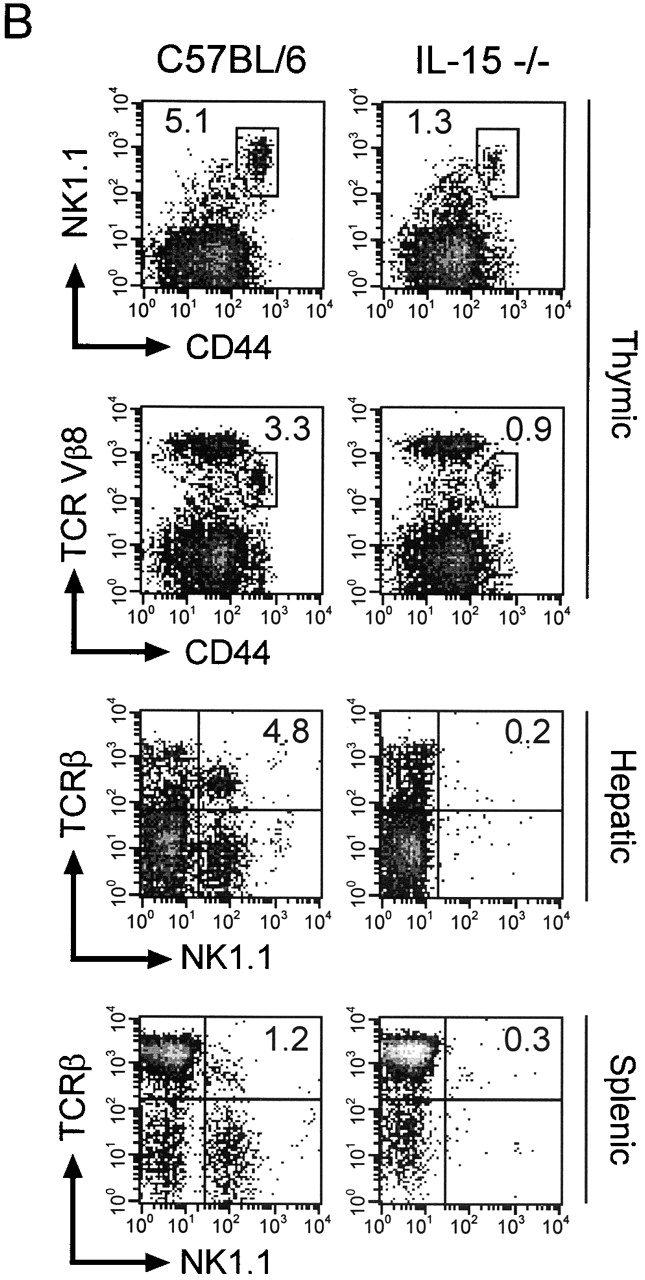
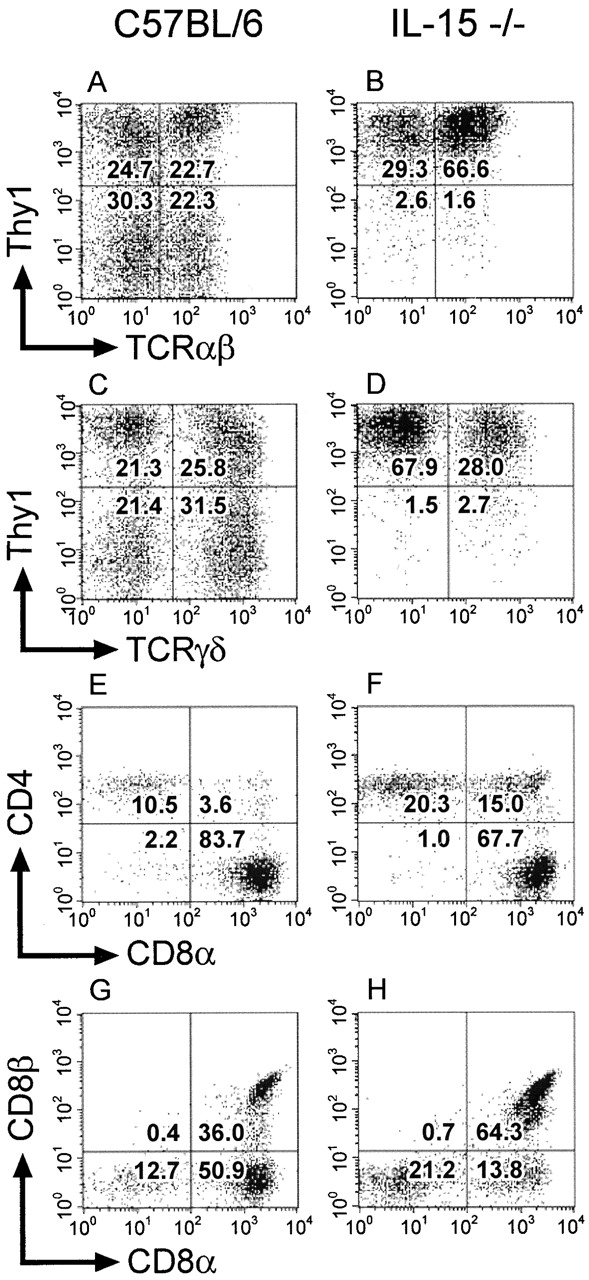
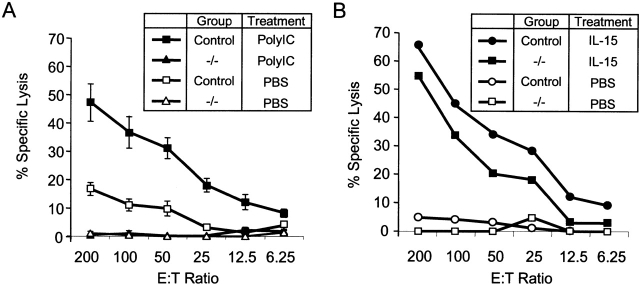
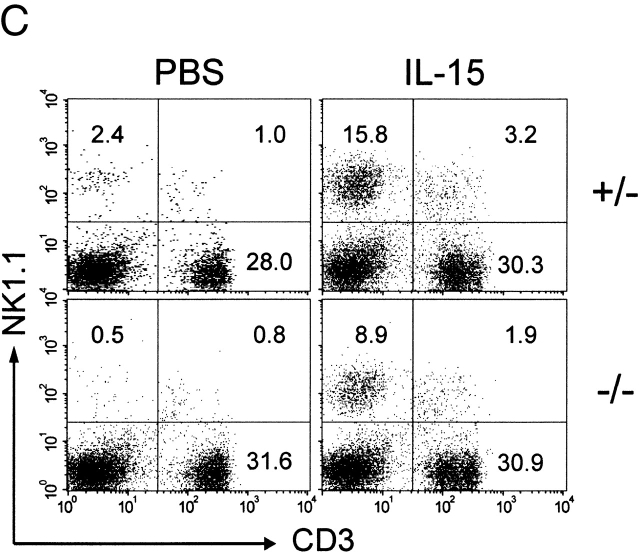
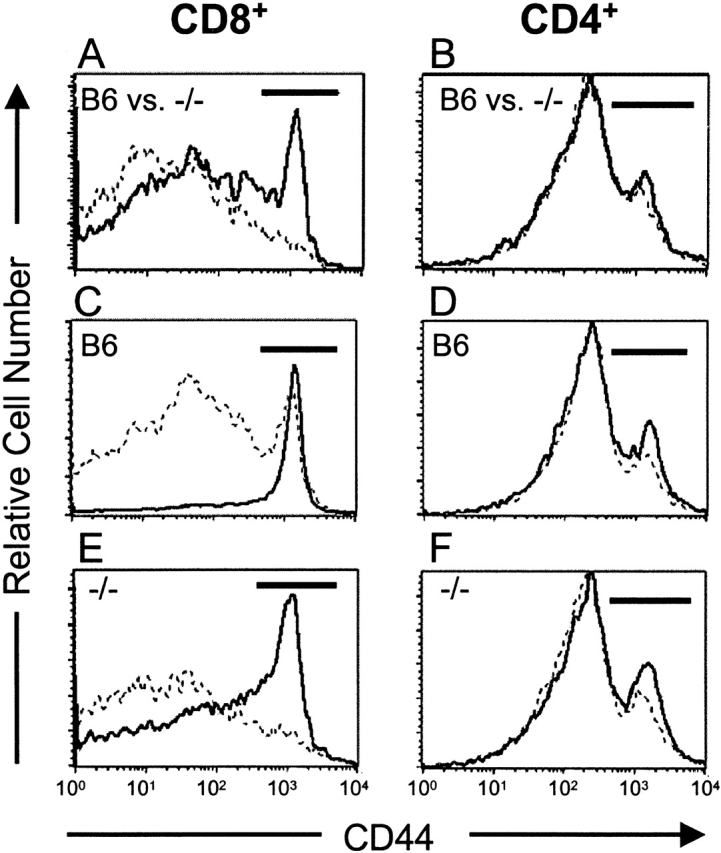
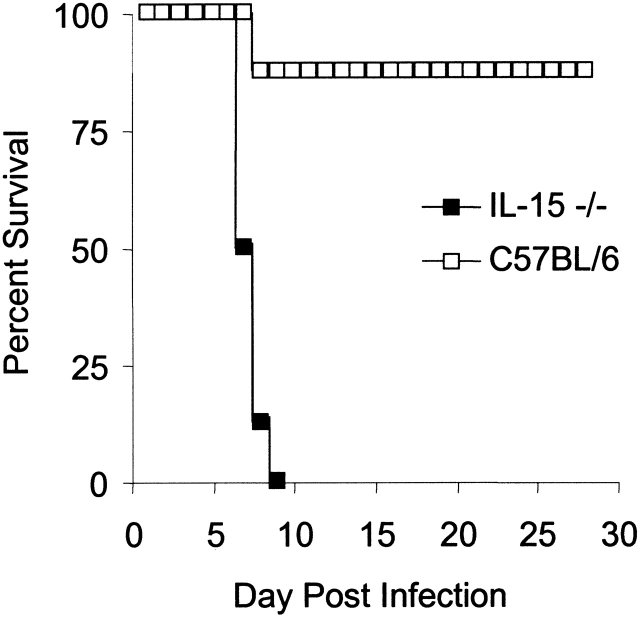
C57BL/6 mice genetically deficient in interleukin 15 (IL-15(-/-) mice) were generated by gene targeting. IL-15(-/-) mice displayed marked reductions in numbers of thymic and peripheral natural killer (NK) T cells, memory phenotype CD8(+) T cells, and distinct subpopulations of intestinal intraepithelial lymphocytes (IELs). The reduction but not absence of these populations in IL-15(-/-) mice likely reflects an important role for IL-15 for expansion and/or survival of these cells. IL-15(-/-) mice lacked NK cells, as assessed by both immunophenotyping and functional criteria, indicating an obligate role for IL-15 in the development and functional maturation of NK cells. Specific defects associated with IL-15 deficiency were reversed by in vivo administration of exogenous IL-15. Despite their immunological defects, IL-15(-/-) mice remained healthy when maintained under specific pathogen-free conditions. However, IL-15(-/-) mice are likely to have compromised host defense responses to various pathogens, as they were unable to mount a protective response to challenge with vaccinia virus. These data reveal critical roles for IL-15 in the development of specific lymphoid lineages. Moreover, the ability to rescue lymphoid defects in IL-15(-/-) mice by IL-15 administration represents a powerful means by which to further elucidate the biological roles of this cytokine.


Figures

Figure 1
Figure 1
Generation of IL-15−/− mice. (A) A gene targeting vector was constructed in which a 7.5-kb SpeI-EcoRV fragment containing IL-15 exons 3–5, encoding amino acids 1–65 of the primary translation product, was replaced with a PGK-neo cassette. A thymidine kinase cassette (MC-TK) was inserted into the 5′ end of the vector. C57BL/6-derived ES cells were electroporated with the IL-15 targeting vector and selected in G418 and ganciclovir. (B) ES cell clones carrying a targeted IL-15 gene were identified by a combination of PCR and genomic Southern blot analyses and injected into BALB/c blastocysts. Resulting male chimeras were bred to C57BL/6 females, and offspring were analyzed for germline transmission of the mutant IL-15 allele by PCR and genomic Southern blot analyses.
Figure 1
Figure 1
Generation of IL-15−/− mice. (A) A gene targeting vector was constructed in which a 7.5-kb SpeI-EcoRV fragment containing IL-15 exons 3–5, encoding amino acids 1–65 of the primary translation product, was replaced with a PGK-neo cassette. A thymidine kinase cassette (MC-TK) was inserted into the 5′ end of the vector. C57BL/6-derived ES cells were electroporated with the IL-15 targeting vector and selected in G418 and ganciclovir. (B) ES cell clones carrying a targeted IL-15 gene were identified by a combination of PCR and genomic Southern blot analyses and injected into BALB/c blastocysts. Resulting male chimeras were bred to C57BL/6 females, and offspring were analyzed for germline transmission of the mutant IL-15 allele by PCR and genomic Southern blot analyses.
Figure 2
Figure 2
Lymphoid organ weights and cellularity. Average values are indicated by the horizontal lines. Significant differences in organ weights or cellularity between groups are indicated with asterisks. (A) Weights of individual spleens or thymi from 10–12.5-wk-old male IL-15+/− or IL-15−/− mice (n = 17–18/group). (B) Total weight of six peripheral LNs (two each of proper axillary, accessory axillary, and inguinal) from individual 10–12.5-wk-old male IL-15+/− or IL-15−/− mice (n = 17–18/group). *P < 0.05 (Student's t test). (C and D) Cellularity data were collected in multiple experiments, each of which used age- and sex-matched mice. The values shown are from both male and female mice between 9 and 20 wk of age. Control mice included IL-15+/− littermates (used in the majority of cases), IL-15+/+ littermates, and C57BL/6 mice. The average number of cells per LN was calculated from the combined cellularity of the six LNs described above. **P < 0.005 (mixed models analysis of variance).
Figure 3
Figure 3
IL-15−/− mice have normal numbers of conventional T cells but reduced numbers of thymic NK T cells. (A) Thymocytes from individual male IL-15+/− (left) or IL-15−/− (right) littermates were analyzed for expression of CD4 and CD8 (n = 2/group; 12–13 wk of age). The numbers shown represent the percentages of cells within each quadrant. The thymic cellularity was similar in both groups. The results shown are representative of three experiments. (B) NK T cell populations of thymocytes (top), intrahepatic mononuclear cells (middle), and splenocytes (bottom) from individual C57BL/6 or IL-15−/− mice. Live gating of the HSAlowCD8low thymocyte population was used to acquire data on CD44hiNK1.1+ or CD44hiTCR Vβ8+ thymocytes. Similarly, live gating of B220null splenocytes was used to acquire data on NK1.1+TCR-β+ splenic NK T cells. The numbers shown represent the percentage of cells with an NK T cell phenotype. (C) Absolute numbers of thymic NK T populations in control and IL-15−/− mice. The numbers shown represent the mean absolute number ± SEM of thymic NK T cell populations from C57BL/6 or IL-15−/− mice (n = 3/group). NK T cell numbers were calculated from the percentages of HSAlow CD8low thymocytes that were Ly6Chi NK1.1+ or CD44hi and NK1.1+, TCR-α/β+, or Vβ8.1,8.2+. The results shown are representative of two experiments.
Figure 3
Figure 3
IL-15−/− mice have normal numbers of conventional T cells but reduced numbers of thymic NK T cells. (A) Thymocytes from individual male IL-15+/− (left) or IL-15−/− (right) littermates were analyzed for expression of CD4 and CD8 (n = 2/group; 12–13 wk of age). The numbers shown represent the percentages of cells within each quadrant. The thymic cellularity was similar in both groups. The results shown are representative of three experiments. (B) NK T cell populations of thymocytes (top), intrahepatic mononuclear cells (middle), and splenocytes (bottom) from individual C57BL/6 or IL-15−/− mice. Live gating of the HSAlowCD8low thymocyte population was used to acquire data on CD44hiNK1.1+ or CD44hiTCR Vβ8+ thymocytes. Similarly, live gating of B220null splenocytes was used to acquire data on NK1.1+TCR-β+ splenic NK T cells. The numbers shown represent the percentage of cells with an NK T cell phenotype. (C) Absolute numbers of thymic NK T populations in control and IL-15−/− mice. The numbers shown represent the mean absolute number ± SEM of thymic NK T cell populations from C57BL/6 or IL-15−/− mice (n = 3/group). NK T cell numbers were calculated from the percentages of HSAlow CD8low thymocytes that were Ly6Chi NK1.1+ or CD44hi and NK1.1+, TCR-α/β+, or Vβ8.1,8.2+. The results shown are representative of two experiments.
Figure 4
Figure 4
IL-15−/− mice have a deficiency in selective populations of IELs. IELs were isolated from individual 8-wk-old female C57BL/6 or IL-15−/− mice (n = 3/group). The isolated IELs were pooled after the individual cell yields were determined for each mouse. The pooled samples were incubated with the indicated mAb and analyzed using three-color flow cytometry. Viable lymphocytes were gated on the basis of forward and side scatter. A total of 200,000 events was collected for each sample. (A–D) IELs were incubated with mAb specific for CD3, Thy1.2, and TCR-α/β or TCR-γ/δ. Gated populations of CD3+ IELs were analyzed for expression of Thy1.2 and TCR-α/β (A and B) or Thy1.2 and TCR-γ/δ (C and D). The numbers shown represent the percentage of CD3+ IELs within each quadrant. (E–H) IELs were incubated with mAb specific for TCR-α/β, CD8α, and CD4 or CD8β. Gated populations of TCR-α/β+ IELs were analyzed for expression of CD4 and CD8α (E and F) or CD8β and CD8α (G and H). The numbers shown represent the percentage of TCR-α/β+ IELs within each quadrant.
Figure 5
Figure 5
IL-15−/− mice have a reversible NK cell defect. (A) In vitro lysis of 51Cr-labeled YAC-1 targets by splenocytes from IL-15−/− (triangles) or littermate control (IL-15+/+ or IL-15+/−; squares) mice treated 24 h previously with PBS (open symbols) or 100 μg polyI:C (filled symbols). Data shown are the mean ± SEM for a total of five mice per group, analyzed in two experiments. The NK activity of splenocytes from IL-15+/− mice was indistinguishable from that of IL-15+/+ mice. None of the splenocytes induced significant lysis of NK-resistant P815 targets (data not shown). (B) In vitro lysis of YAC-1 targets by splenocytes from control (circles) or IL-15−/− (squares) mice treated with PBS (open symbols) or IL-15 (filled symbols). Groups of two IL-15−/− or control (IL-15+/+ or IL-15+/−) mice were injected intraperitoneally with PBS or 10 μg human IL-15 once daily for 7 d. Spleens were removed 24 h after the last injection. The responses of the individual mice in each group were similar, and the data are shown as the average response of two mice per group. Significant lysis of P815 targets was observed only with splenocytes from IL-15–treated control mice and only at the highest E/T ratio (30% lysis at E/T of 200:1; data not shown). The results shown are representative of two experiments. (C) Splenocytes from mice treated as described in B were analyzed for cell surface expression of NK1.1 and CD3. The numbers shown represent the percentage of cells within each quadrant. The results are representative of four experiments. Data not shown: splenic cellularity was similar in PBS-treated control and IL-15−/− mice. IL-15 treatment increased the splenic cellularity ∼1.5–2-fold in both groups of mice.
Figure 5
Figure 5
IL-15−/− mice have a reversible NK cell defect. (A) In vitro lysis of 51Cr-labeled YAC-1 targets by splenocytes from IL-15−/− (triangles) or littermate control (IL-15+/+ or IL-15+/−; squares) mice treated 24 h previously with PBS (open symbols) or 100 μg polyI:C (filled symbols). Data shown are the mean ± SEM for a total of five mice per group, analyzed in two experiments. The NK activity of splenocytes from IL-15+/− mice was indistinguishable from that of IL-15+/+ mice. None of the splenocytes induced significant lysis of NK-resistant P815 targets (data not shown). (B) In vitro lysis of YAC-1 targets by splenocytes from control (circles) or IL-15−/− (squares) mice treated with PBS (open symbols) or IL-15 (filled symbols). Groups of two IL-15−/− or control (IL-15+/+ or IL-15+/−) mice were injected intraperitoneally with PBS or 10 μg human IL-15 once daily for 7 d. Spleens were removed 24 h after the last injection. The responses of the individual mice in each group were similar, and the data are shown as the average response of two mice per group. Significant lysis of P815 targets was observed only with splenocytes from IL-15–treated control mice and only at the highest E/T ratio (30% lysis at E/T of 200:1; data not shown). The results shown are representative of two experiments. (C) Splenocytes from mice treated as described in B were analyzed for cell surface expression of NK1.1 and CD3. The numbers shown represent the percentage of cells within each quadrant. The results are representative of four experiments. Data not shown: splenic cellularity was similar in PBS-treated control and IL-15−/− mice. IL-15 treatment increased the splenic cellularity ∼1.5–2-fold in both groups of mice.
Figure 6
Figure 6
IL-15−/− mice have a reversible defect in CD8+ memory phenotype (CD44hi) T cells. Splenocytes and LN cells were incubated with mAb specific for CD4, CD8, and CD44. Gated populations of CD8+ or CD4+ cells were analyzed for expression of CD44. The CD44hi populations are indicated by the horizontal bars on each histogram. (A and B) CD44 expression was analyzed on CD8+ and CD4+ splenocytes and LN cells from individual 15-wk-old naive C57BL/6 (B6) or IL-15−/− female mice (n = 4/group). Similar patterns were observed in both LNs (not shown) and spleen. (A) CD44 expression on CD8+ splenocytes from control (solid line) or IL-15−/− (dashed line) mice. The mean percentage ± SEM of CD44hi cells within the CD8+ population was 19 ± 2% for control mice and 6.5 ± 0.5% for IL-15−/− mice. (B) CD44 expression on CD4+splenocytes from control (solid line; 22.2 ± 2% CD44hi) or IL-15−/− (dashed line; 22 ± 1% CD44hi) mice. (C–F) 9-wk-old C57BL/6 or IL-15−/− female mice (n = 3/group) were injected intraperitoneally with PBS (dashed line) or 10 μg human IL-15 (solid line) once daily for 7 d. Spleens and LNs were removed 24 h after the last injection. Single cell suspensions from individual mice were analyzed for CD4, CD8, and CD44 expression as described above. Similar changes were observed in both LNs (not shown) and spleen (see Table for summary of data). (C and E) CD44 expression on CD8+ splenocytes from PBS- or IL-15–treated control (C) or IL-15−/− (E) mice. (D and F) CD44 expression on CD4+ splenocytes from PBS- or IL-15–treated control (D) or IL-15−/− (F) mice.
Figure 7
Figure 7
Susceptibility of IL-15−/− mice to infection with vaccinia virus. Groups of eight female C57BL/6 or IL-15−/− mice were inoculated intravenously with 106 PFU of vaccinia virus. Mice were monitored daily for morbidity (data not shown) and mortality. Data shown are representative of two experiments.

Comment in

References

    1. Giri J.G., Anderson D.M., Kumaki S., Park L.S., Grabstein K.H., Cosman D. IL-15, a novel T cell growth factor that shares activities and receptor components with IL-2. J. Leukoc. Biol. 1995;57:763–766. - PubMed
    1. Burton J.D., Bamford R.N., Peters C., Grant A.J., Kurys G., Goldman C.K., Brennan J., Roessler E., Waldmann T.A. A lymphokine, provisionally designated interleukin T and produced by a human adult T-cell leukemia line, stimulates T-cell proliferation and the induction of lymphokine-activated killer cells. Proc. Natl. Acad. Sci. USA. 1994;91:4935–4939. - PMC - PubMed
    1. Leonard W.J., Shores E.W., Love P.E. Role of the common cytokine receptor γ chain in cytokine signaling and lymphoid development. Immunol. Rev. 1995;148:97–114. - PubMed
    1. Giri J.G., Ahdieh M., Eisenman J., Shanebeck K., Grabstein K., Kumaki S., Namen A., Park L.S., Cosman D., Anderson D. Utilization of the β and γ chains of the IL-2 receptor by the novel cytokine IL-15. EMBO (Eur. Mol. Biol. Organ.) J. 1994;13:2822–2830. - PMC - PubMed
    1. Carson W.E., Giri J.G., Lindemann M.J., Linett M.L., Ahdieh M., Paxton R., Anderson D., Eisenman J., Grabstein K., Caligiuri M.A. Interleukin (IL) 15 is a novel cytokine that activates human natural killer cells via components of the IL-2 receptor. J. Exp. Med. 1994;180:1395–1403. - PMC - PubMed

Publication types

MeSH terms