

Mapping the energy of superantigen Staphylococcus enterotoxin C3 recognition of an alpha/beta T cell receptor using alanine scanning mutagenesis
- PMID: 10704464
- PMCID: PMC2195847
- DOI: 10.1084/jem.191.5.835
Mapping the energy of superantigen Staphylococcus enterotoxin C3 recognition of an alpha/beta T cell receptor using alanine scanning mutagenesis
Abstract
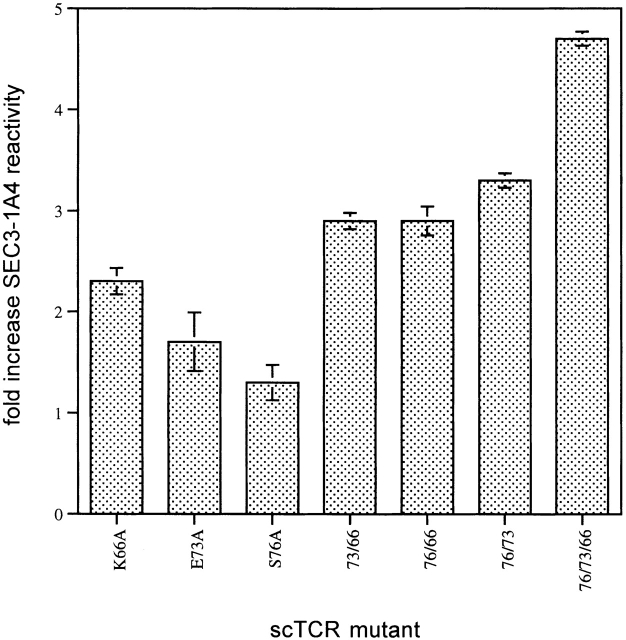
Binding of the T cell receptor (TCR) to a bacterial superantigen (SAG) results in stimulation of a large population of T cells and subsequent inflammatory reactions. To define the functional contribution of TCR residues to SAG recognition, binding by 24 single-site alanine substitutions in the TCR Vbeta domain to Staphylococcus aureus enterotoxin (SE) C3 was measured, producing an energy map of the TCR-SAG interaction. The results showed that complementarity determining region 2 (CDR2) of the Vbeta contributed the majority of binding energy, whereas hypervariable region 4 (HV4) and framework region 3 (FR3) contributed a minimal amount of energy. The crystal structure of the Vbeta8.2-SEC3 complex suggests that the CDR2 mutations act by disrupting Vbeta main chain interactions with SEC3, perhaps by affecting the conformation of CDR2. The finding that single Vbeta side chain substitutions had significant effects on binding and that other SEC3-reactive Vbeta are diverse at these same positions indicates that SEC3 binds to other TCRs through compensatory mechanisms. Thus, there appears to be strong selective pressure on SAGs to maintain binding to diverse T cells.
Figures
Similar articles
-
Structure-function studies of T-cell receptor-superantigen interactions.Immunol Rev. 1998 Jun;163:177-86. doi: 10.1111/j.1600-065x.1998.tb01196.x. Immunol Rev. 1998. PMID: 9700510 Review.
-
Crystal structure of a T-cell receptor beta-chain complexed with a superantigen.Nature. 1996 Nov 14;384(6605):188-92. doi: 10.1038/384188a0. Nature. 1996. PMID: 8906797
-
Different superantigens interact with distinct sites in the Vbeta domain of a single T cell receptor.J Exp Med. 1996 Apr 1;183(4):1437-46. doi: 10.1084/jem.183.4.1437. J Exp Med. 1996. PMID: 8666902 Free PMC article.
-
A mutational analysis of the binding of staphylococcal enterotoxins B and C3 to the T cell receptor beta chain and major histocompatibility complex class II.J Exp Med. 1998 Mar 16;187(6):823-33. doi: 10.1084/jem.187.6.823. J Exp Med. 1998. PMID: 9500785 Free PMC article.
-
Soluble T cell receptor Vβ domains engineered for high-affinity binding to staphylococcal or streptococcal superantigens.Toxins (Basel). 2014 Jan 28;6(2):556-74. doi: 10.3390/toxins6020556. Toxins (Basel). 2014. PMID: 24476714 Free PMC article. Review.
Cited by
-
Molecular basis of a million-fold affinity maturation process in a protein-protein interaction.J Mol Biol. 2011 Aug 12;411(2):321-8. doi: 10.1016/j.jmb.2011.06.009. Epub 2011 Jun 12. J Mol Biol. 2011. PMID: 21689661 Free PMC article.
-
A single, engineered protein therapeutic agent neutralizes exotoxins from both Staphylococcus aureus and Streptococcus pyogenes.Clin Vaccine Immunol. 2010 Nov;17(11):1781-9. doi: 10.1128/CVI.00277-10. Epub 2010 Sep 22. Clin Vaccine Immunol. 2010. PMID: 20861327 Free PMC article.
-
Engineering a soluble high-affinity receptor domain that neutralizes staphylococcal enterotoxin C in rabbit models of disease.Protein Eng Des Sel. 2013 Feb;26(2):133-42. doi: 10.1093/protein/gzs094. Epub 2012 Nov 15. Protein Eng Des Sel. 2013. PMID: 23161916 Free PMC article.
-
Structural basis of affinity maturation and intramolecular cooperativity in a protein-protein interaction.Structure. 2005 Dec;13(12):1775-87. doi: 10.1016/j.str.2005.08.015. Structure. 2005. PMID: 16338406 Free PMC article.
-
Assessing energetic contributions to binding from a disordered region in a protein-protein interaction.Biochemistry. 2010 Nov 2;49(43):9256-68. doi: 10.1021/bi1008968. Biochemistry. 2010. PMID: 20836565 Free PMC article.
References
-
- Marrack P., Kappler J. The staphylococcal enterotoxins and their relatives. Science. 1990;248:705–711. - PubMed
-
- Papageorgiou A.C., Acharya K.R. Superantigens as immunomodulatorsrecent structural insights. Structure. 1997;5:991–996. - PubMed
-
- Kotzin B.L., Leung D.Y.M., Kappler J., Marrack P. Superantigens and their potential role in human disease. Adv. Immunol. 1993;54:99–166. - PubMed
-
- Scherer M.T., Ignatowicz L., Winslow G.M., Kappler J.W., Marrack P. Superantigensbacterial and viral proteins that manipulate the immune system. Annu. Rev. Cell Biol. 1993;9:101–128. - PubMed
-
- Bernal A., Proft T., Fraser J.D., Posnett D.N. Superantigens in human disease. J. Clin. Immunol. 1999;19:149–157. - PubMed
Publication types
MeSH terms
Substances
Grants and funding
LinkOut - more resources
Full Text Sources
Other Literature Sources
Miscellaneous
