. 2000 Mar 15;20(6):2073-85.
doi: 10.1523/JNEUROSCI.20-06-02073.2000.

Heterogeneous conductance levels of native AMPA receptors

Affiliations

Heterogeneous conductance levels of native AMPA receptors

T C Smith et al. J Neurosci. .

Abstract

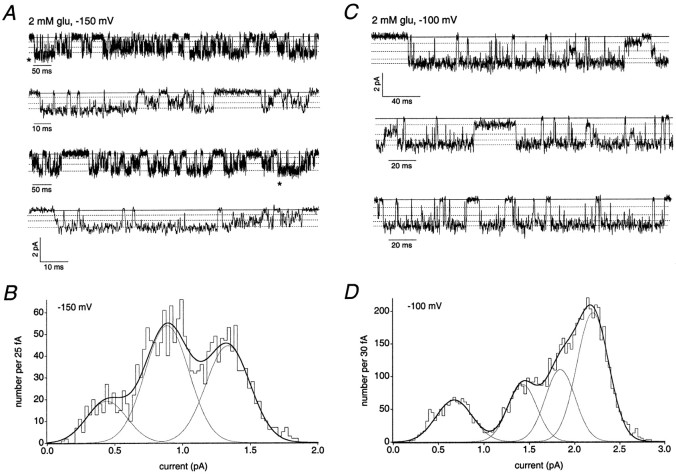
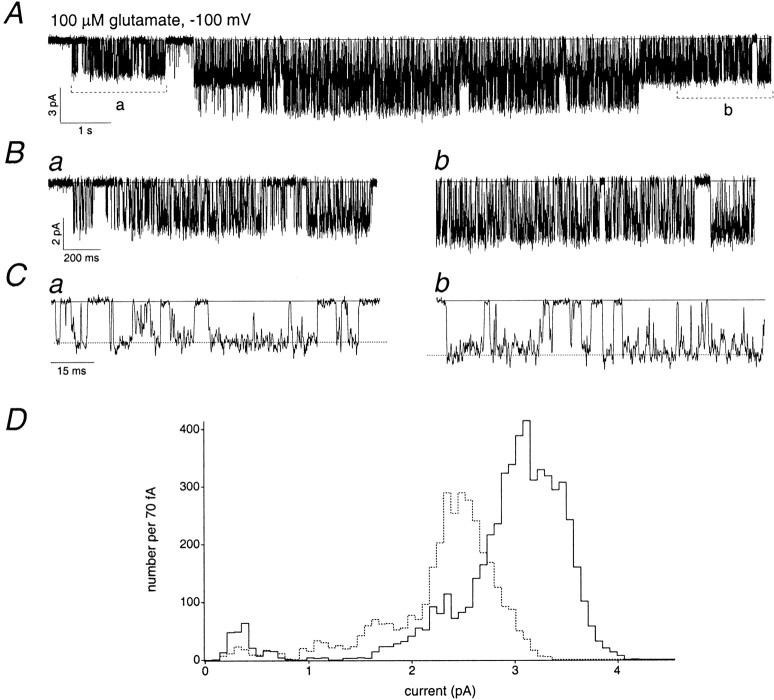
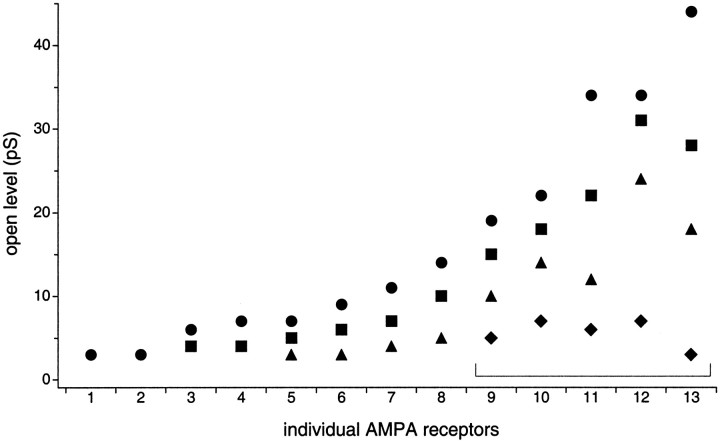
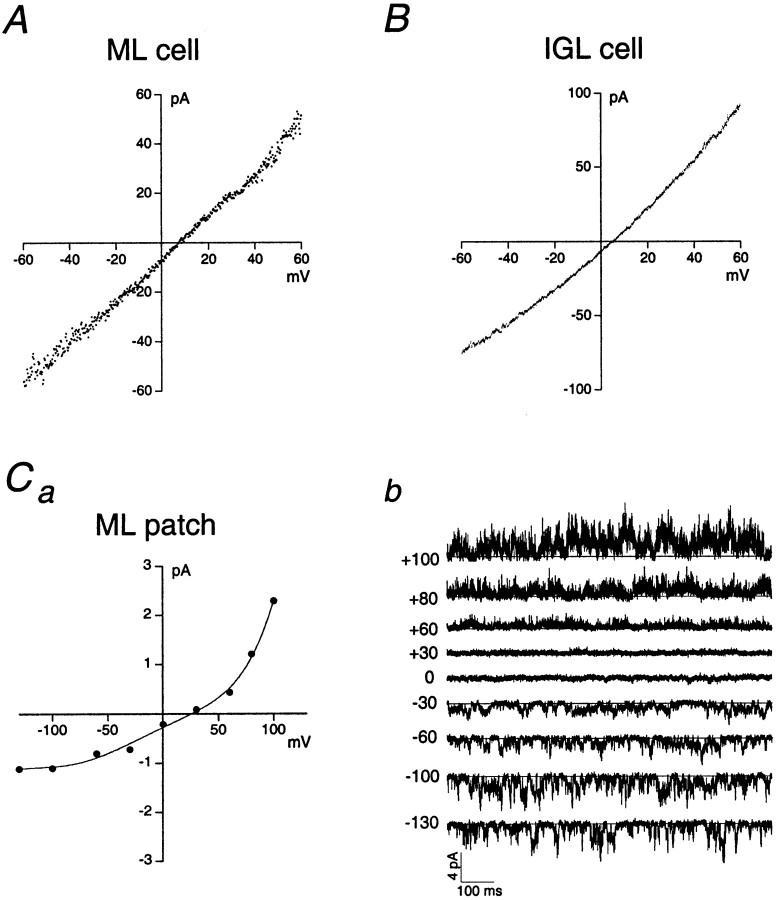
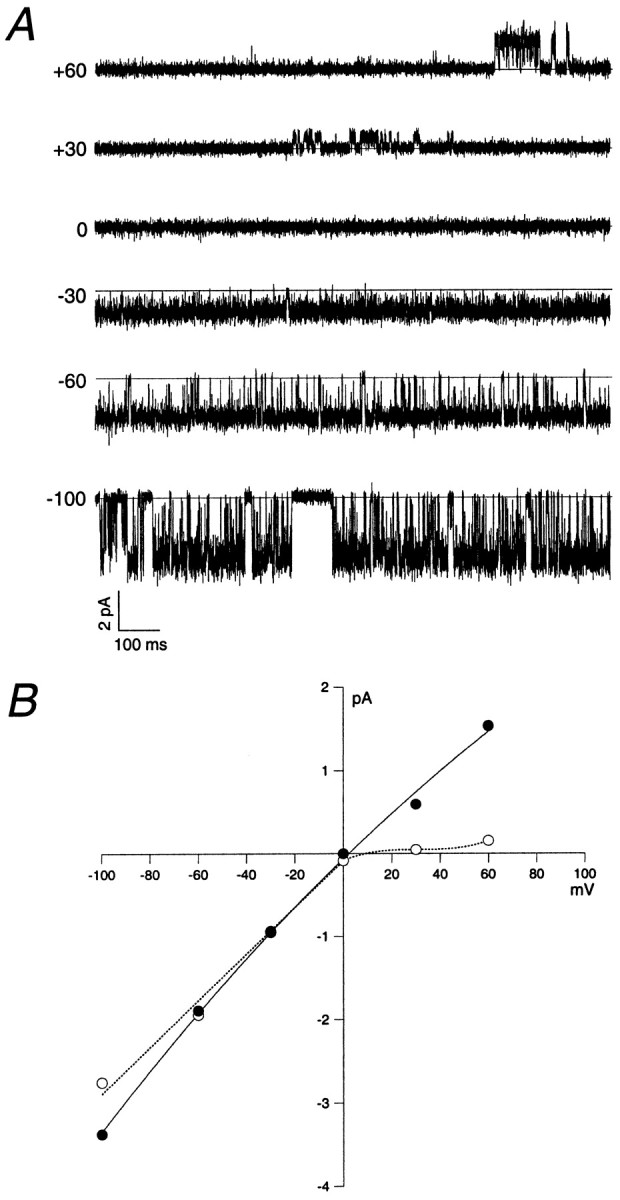
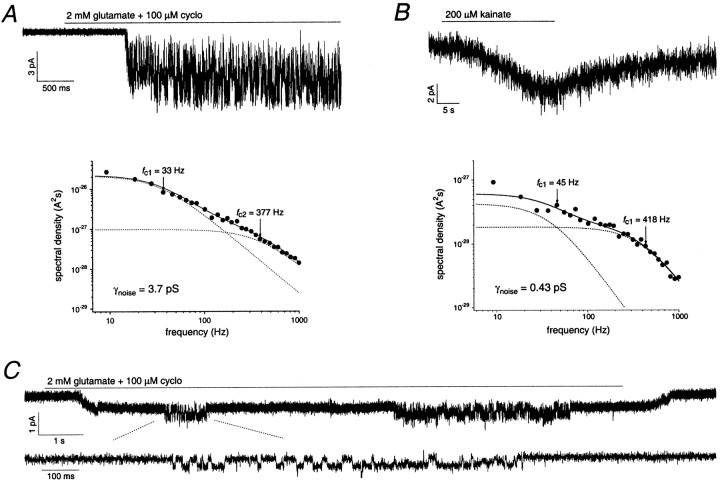
The single-channel properties of AMPA receptors can affect information processing in neurons by influencing the amplitude and kinetics of synaptic currents, yet little is known about the unitary properties of native AMPA receptors in situ. Using whole-cell and outside-out patch-clamp recordings from granule cells in acute cerebellar slices, we found that migrating granule cells begin to express AMPA receptors before they arrive in the internal granule cell layer and receive synaptic input. At saturating agonist concentrations, the open probability of channels in outside-out patches from migrating cells was very high, allowing us to identify patches that contained only one or two active channels. Analysis of the single-channel activity in these patches showed that individual AMPA receptors exhibit as many as four distinguishable conductance levels. The conductance levels observed varied substantially for different channels, although on average the values fell within the range of unitary conductances estimated previously for synaptic AMPA receptors. In contrast to patches from migrating granule cells, we rarely observed directly resolvable single-channel currents in patches excised from the somata of granule cells in the internal granular layer, even though these cells gave large AMPA receptor whole-cell currents. We did, however, detect AMPA receptors with apparent unitary conductances of <1 pS in patches from both migrating and mature granule cells. Our results suggest that granule cells express a heterogeneous population of AMPA receptors, a subset of which are segregated to postsynaptic sites after synaptogenesis.


Figures

None
Models.
Fig. 1.
Fig. 1.
Whole-cell currents through AMPA receptors increase as cerebellar granule cells mature. The first fourbars (left to right) denote mean currents evoked by saturating concentrations of kainate (300–600 μm) in EGL, ML, immature IGL, and mature IGL cells, respectively; the last bar on theright is the mean current evoked in mature IGL cells by 100 μm kainate. Inspection of all the data indicated that the steady-state current amplitudes were log-normally distributed. The logarithms of the individual current amplitudes were used to calculate the mean and SEM for each sample population. The figure shows the antilogs of the values (mean ± SEM) obtained from the log-normal distributions: EGL, 2.3 pA (n = 9 cells); ML, 27.5 pA (n = 5 cells); immature IGL (<P40), 57.5 pA (n = 9 cells); mature IGL (>P40), 178 pA (n = 3 cells); and mature IGL (100 μmkainate), 135 pA (n = 5 cells). There were no significant differences in whole-cell capacitance between the granule cells in the different groups.
Fig. 2.
Fig. 2.
Single-channel activity of an AMPA receptor expressed by a migrating granule cell. Holding potential, −100 mV.A, Steady-state activity of an AMPA receptor in an outside-out patch from a granule cell in the ML. Glutamate (2 mm) and cyclothiazide (100 μm) were present throughout the recording. The zero current level is indicated by thesolidhorizontallines. Data were sampled at 31.3 kHz and low-pass filtered at 2 kHz (−3 dB). B, Portions of the single-channel recording shown in the toptrace of A on a faster time scale.
Fig. 3.
Fig. 3.
The observed current levels in outside-out patch recordings are inconsistent with the activity of multiple channels.A, Analysis of data from a putative one-channel recording. The filledbars indicate the proportion of time at each open level (PN) observed during steady-state activity evoked by 2 mm glutamate (with cyclothiazide). The openbars indicate the proportion of time at each current level predicted from the binomial distribution (described in Materials and Methods) if the currents in the record arose from the activity of three independently gating channels. B, Mean ratios (± SEM) of the observedPN to thePN predicted from the binomial distribution (if the activity arose from multiple independently gating channels). The results are from eight records in which two (circles), three (squares), or four (triangles) open levels were evident (n = 2, 3, and 3 individual channels, respectively). Note that the y-axis is discontinuous. For points off the scale, the mean ratios are given inparentheses.
Fig. 4.
Fig. 4.
AMPA receptors expressed by migrating granule cells show heterogeneity in the number and amplitudes of their conductance sublevels. The zero current levels are indicated bysolidlines. Open levels are indicated bydottedlines. Channel currents were activated by 2 mm glutamate in the presence of 100 μm cyclothiazide. A, Outside-out patch recording from a granule cell in the ML. Holding potential, −150 mV. The second and fourthtraces from the top are expanded portions of the first and thirdtraces, respectively, the beginning of which are indicated by asterisks. Data were sampled at 47 kHz and low-pass filtered at 2 kHz (−3 dB). B, Histogram of mean low-variance open points from the channel recording shown inA. The histogram was fitted with the sum of three Gaussian components, giving mean conductance levels of 3, 6, and 9 pS (thinlines, individual Gaussian components; thickline, sum of individual components). C, Outside-out patch recording from a granule cell in the ML. Holding potential, −100 mV. Data were sampled at 31.3 kHz and low-pass filtered at 2 kHz (−3 dB). D, Histogram of mean low-variance open points from the channel recording shown in C. The histogram was fitted with the sum of four Gaussian components, giving mean conductance levels of 7, 14, 18, and 22 pS (thinlines, individual Gaussian components; thickline, sum of individual components).
Fig. 5.
Fig. 5.
Two AMPA receptors with different single-channel conductances in the same outside-out patch. Holding potential, −100 mV. Data were sampled at 31.3 kHz and low-pass filtered at 2 kHz (−3 dB). A, Outside-out patch recording from a granule cell in the ML. Note that two channels are active simultaneously in the middle of the recording.Ba, Portion from the beginning of the recording inA on a faster time scale, where only the smaller channel is active. b, Portion near the end of the recording inA on a faster time scale, where only the larger channel is active. Ca,b, Portions of records inB on a faster time scale to show the difference in the largest conductance levels (dottedhorizontallines). D, Overlaid histograms of low-variance open points from each channel. Theshaded histogram is derived from the activity of the smaller channel in Ba. The unshadedhistogram is derived from the activity of the larger channel inBb.
Fig. 6.
Fig. 6.
Heterogeneous open levels of AMPA receptors expressed by granule cells in situ. Amplitudes of the open levels (in picosiemens) of 13 individual AMPA receptors observed in outside-out patch recordings (circles,squares, triangles, anddiamonds show levels in order of decreasing amplitude). Current levels were measured at −100 mV (or −150 mV for channel 6) using mean low-variance analysis and/or hidden Markov analysis and converted to conductances using a reversal potential of 0 mV. Channels 11–13 showed rapid kinetics and were analyzed exclusively with hidden Markov modeling. Channels are plotted in order of increasing amplitude of the largest open level. For each channel where four open levels were detected (channels 9–13, brackets), HMM fits with four open states were significantly better than fits with three open states.
Fig. 7.
Fig. 7.
Rate constants obtained from hidden Markov modeling for two channels in different ML patches. The mean dwell times (in milliseconds) are shown for the four open states (states 5–8) in boldtype. Rate constants >1000 sec−1 were rounded to three significant figures. A, The channel that gave these results is the channel illustrated in Figure 4C. This channel displayed relatively long-lived sojourns in the various open levels. Both HMM and mean low-variance analysis gave conductance levels of 7, 14, 18, and 22 pS (states 5–8, respectively).B, The channel that gave these results is illustrated in Figure 5, Ba and Ca. The rapid kinetics of this channel made estimates of the open levels from mean low-variance analysis unreliable. The conductances obtained from HMM analysis were 6, 15, 22, and 34 pS (states 5–8, respectively). The mean open times estimated for this channel were all <100 μsec.
Fig. 8.
Fig. 8.
Whole-cell currents through AMPA receptors in granule cells show linear or outwardly rectifying current–voltage relations, as do some ensemble patch currents. A, B, Whole-cell I–V curves from a granule cell in the ML (A) and the IGL (B).C, I–V curve (a) and ensemble currents (b) from an outside-out patch excised from a granule cell in the ML. Several channels were active in this patch. Holding potentials (in millivolts) are indicated to the left of the traces inb. Data were sampled at 31.3 kHz and low-pass filtered at 2 kHz (−3 dB).
Fig. 9.
Fig. 9.
Inwardly rectifying AMPA receptor expressed by a migrating granule cell. A, Outside-out patch recording from a granule cell in the ML. Holding potentials (in millivolts) are indicated to the left of the traces. Glutamate (2 mm) and cyclothiazide (100 μm) were present throughout the recording. Data were sampled at 31.3 kHz and low-pass filtered at 2 kHz (−3 dB). B,I–V relations for the channel shown inA. The filledcirclesindicate the single-channel current (largest detectable open level) at each potential, whereas the opencirclesdenote the average current passing through the channel per unit time at each potential (from 4.5 sec of continuous data at each potential).
Fig. 10.
Fig. 10.
Granule cells express AMPA receptors with femtoseiman conductances. A, Top, Outside-out patch from a granule cell in the ML. Data were sampled at 9.4 kHz and low-pass filtered at 2 kHz (−3 dB). Bottom, Power spectrum of the steady-state ensemble patch current shown inA, top; γnoise = 3.7 pS (not corrected forpopen). B,Top, Outside-out patch from a mature IGL cell (P47). Note the much smaller agonist-induced current noise compared with the recording in A. Data were sampled at 9.4 kHz and low-pass filtered at 2 kHz (−3 dB). Bottom, Power spectrum of the steady-state ensemble patch current shown inA, top; γnoise = 0.43 pS (not corrected for popen).C, Outside-out patch recording from a granule cell in the ML. Note the small sustained inward current, in addition to the single-channel activity (shown on an expanded time scale in thebottomtrace). Data were sampled at 31.3 kHz and low-pass filtered at 1 kHz (−3 dB). The different kinetics of the ensemble patch currents in B and Creflect differences in the rates of solution exchange in the two experiments. cyclo, Cyclothiazide.

References

    1. Altman J. Postnatal development of the cerebellar cortex in the rat. I. The external germinal layer and the transitional molecular layer. J Comp Neurol. 1972a;145:353–398. - PubMed
    1. Altman J. Postnatal development of the cerebellar cortex in the rat. II. Maturation of the components of the granular layer. J Comp Neurol. 1972b;145:465–514. - PubMed
    1. Anderson MJ, Cohen MW. Nerve-induced spontaneous redistribution of acetylcholine receptors on cultured muscle cells. J Physiol (Lond) 1977;268:757–773. - PMC - PubMed
    1. Ascher P, Nowak L. Quisqualate- and kainate-activated channels in mouse central neurones in culture. J Physiol (Lond) 1988;399:227–245. - PMC - PubMed
    1. Bechade C, Colin I, Kirsch J, Betz H, Triller A. Expression of glycine receptor subunits and gephyrin in cultured spinal neurons. Eur J Neurosci. 1996;8:429–435. - PubMed

Publication types

MeSH terms

LinkOut - more resources