. 2000 Mar 15;20(6):2209-17.
doi: 10.1523/JNEUROSCI.20-06-02209.2000.

Mice lacking G-protein receptor kinase 1 have profoundly slowed recovery of cone-driven retinal responses

Affiliations

Mice lacking G-protein receptor kinase 1 have profoundly slowed recovery of cone-driven retinal responses

A L Lyubarsky et al. J Neurosci. .

Abstract

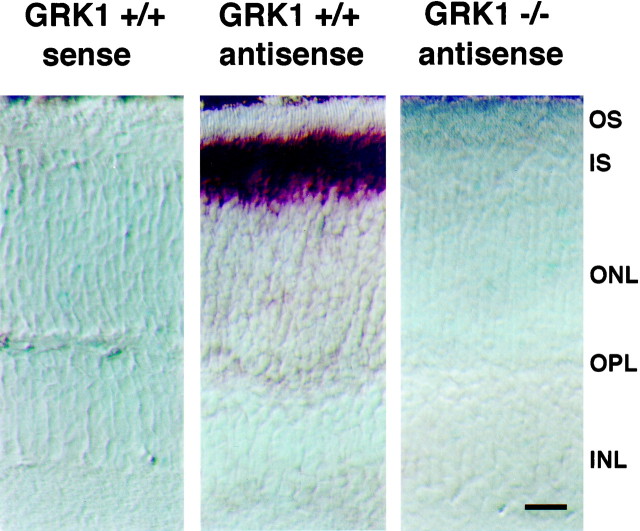
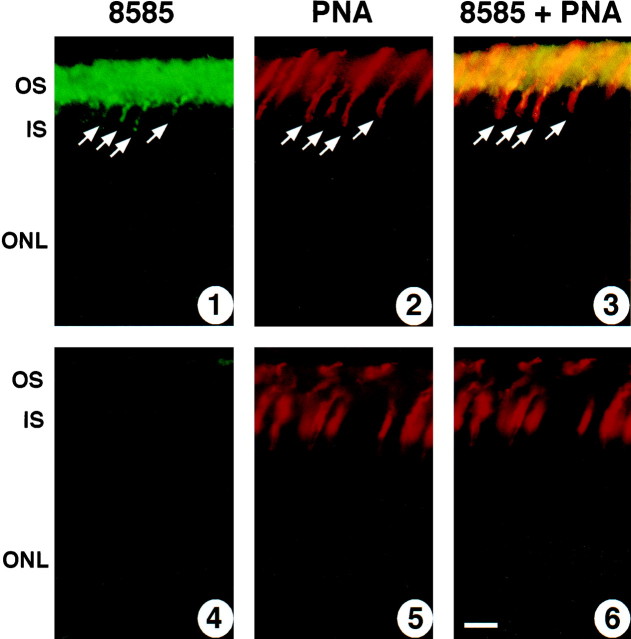
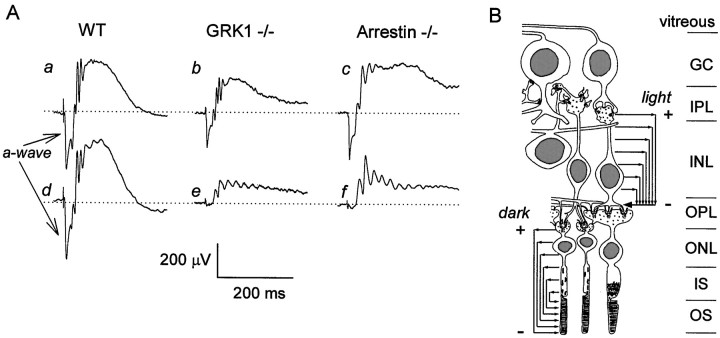
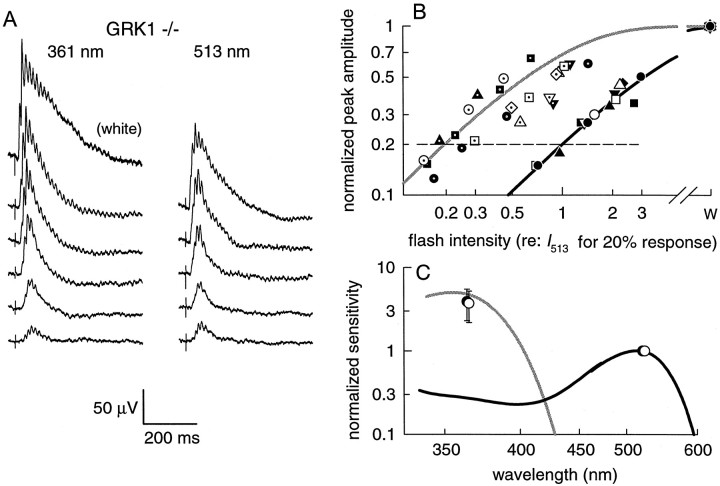
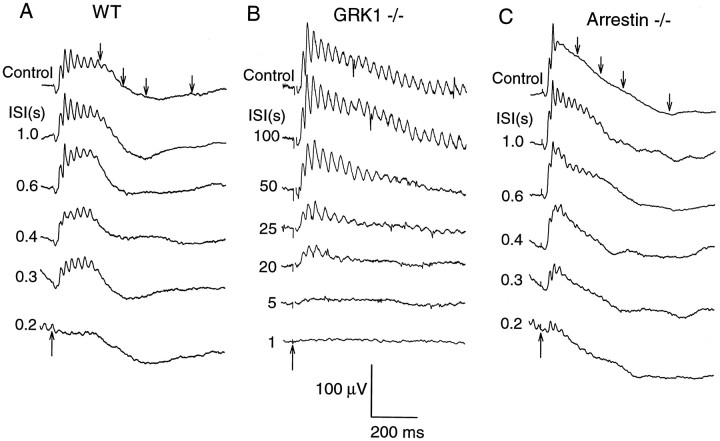
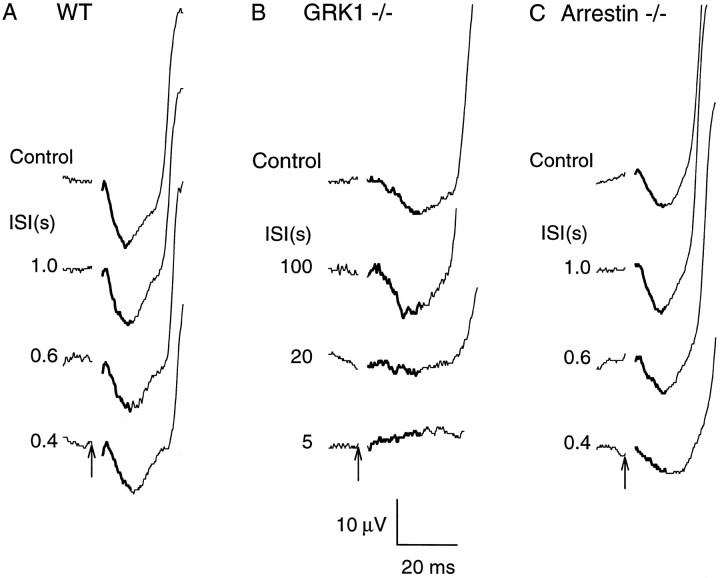
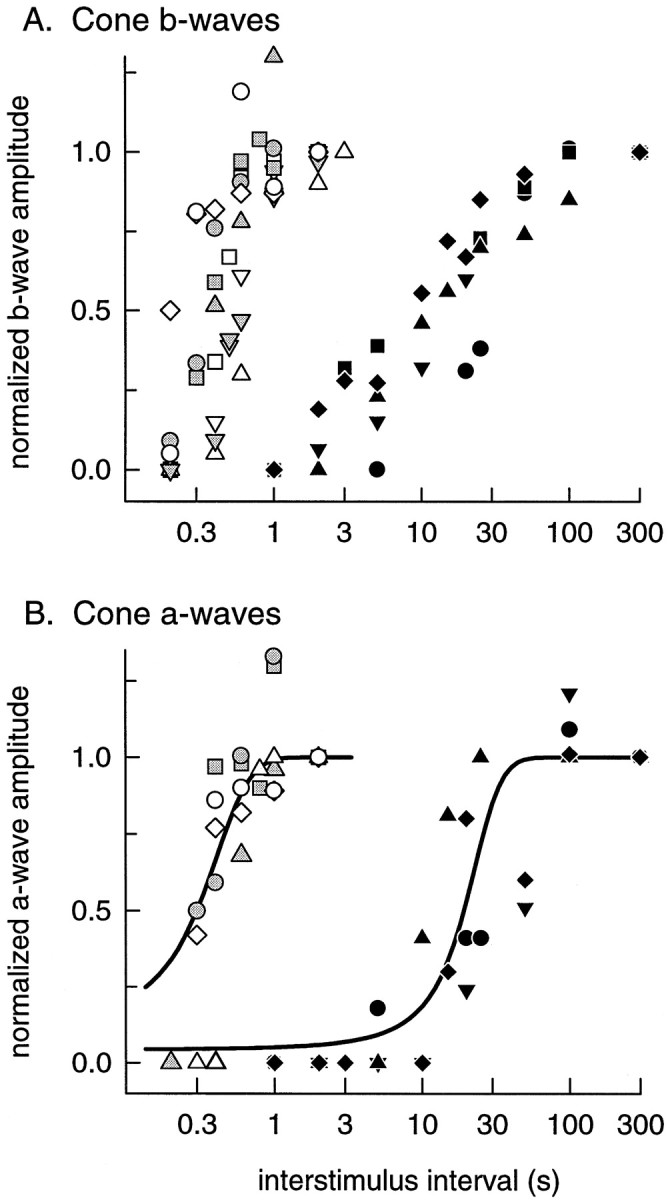
G-Protein receptor kinase 1 (GRK1) ("rhodopsin kinase") is necessary for the inactivation of photoactivated rhodopsin, the light receptor of the G-protein transduction cascade of rod photoreceptors. GRK1 has also been reported to be present in retinal cones in which its function is unknown. To examine the role of GRK1 in retinal cone signaling pathways, we measured in mice having null mutations of GRK1 (GRK1 -/-) cone-driven electroretinographic (ERG) responses, including an a-wave component identified as the field potential generated by suppression of the circulating current of the cone photoreceptors. Dark-adapted GRK1 -/- animals generated cone-driven ERGs having saturating amplitudes and sensitivities in both visible and UV spectral regions similar to those of wild-type (WT) mice. However, after exposure to a bright conditioning flash, the cone-driven ERGs of GRK1 -/- animals recovered 30-50 times more slowly than those of WT mice and similarly slower than the cone-driven ERGs of mice homozygously null for arrestin (Arrestin -/-), whose cone (but not rod) response recoveries were found to be as rapid as those of WT. Our observations argue that GRK1 is essential for normal deactivation of murine cone phototransduction and provide the first functional evidence for a major role of a specific GRK in the inactivation of vertebrate cone phototransduction.


Figures

Fig. 1.
Fig. 1.
Localization of GRK1 mRNA expression in the retina. In situ hybridization was performed as described in Materials and Methods. Each panel is from a different retinal section of a mouse with genotype as labeled above the panel. The GRK1 antisense probe, which binds to the complementary message, strongly labels the layer corresponding to the photoreceptor inner segments of the WT mouse retina (GRK1 +/+, middle); antisense labeling is missing in the GRK1 −/− retina (right). The GRK1 sense probe serves as a control for nonspecific labeling (left). Scale bar, 30 μm. OS, Outer segment; IS, inner segment;ONL, outer nuclear layer; OPL, outer plexiform layer; INL, inner nuclear layer.
Fig. 2.
Fig. 2.
Localization GRK1 in rod and cone photoreceptor outer segments. Immunocytochemistry was performed as described in Materials and Methods on retinal sections from WT mice; 1–3show images made from a single section of WT retina and 4–6from a single section of GRK1 −/− retina. GRK1-specific antibody 8585 was raised in rabbit against the first 50 amino acids of bovine GRK1; its binding was visualized with fluorescein-conjugated goat anti-rabbit antibody (1, 3, 4, 6). Biotin-conjugated PNA, which binds to cone membranes, was used to localize cone photoreceptors; its binding was visualized by conjugation with Texas Red-conjugated streptavidin (2, 3, 5, 6). The outer segment layer of the retina of WT mice is strongly labeled with 8585 antibody (1); WT cones seen to be labeled with PNA in 2are also clearly labeled with 8585 (arrows in1–3). Both rod and cone outer segments of GRK1 −/− mouse are negative for GRK1 (4). Scale bar, 30 μm. Layer abbreviations are given in Figure 1.
Fig. 3.
Fig. 3.
ERGs (transretinal field potentials) from WT, GRK1 −/−, and Arrestin −/− mice, and cellular basis of the a- and b-waves of the ERG. A, A white flash isomerizing ∼1% of the rhodopsin in the retina was delivered in a ganzfeld to each dark-adapted animal, generating responses a–c; the response to the same flash was then recorded again after 2 min in darkness for the WT (d), after 15 min for the GRK1 −/− (e), and after 20 min for the Arrestin −/− (f) mouse. The initial corneal-negative component clearly seen ina–d is the a-wave, and the corneal-positive deflections that follow (and truncate) the a-wave are a mixture of rod- and cone-driven b-waves and the so-called oscillatory potentials (Gorgels and Norren, 1992). B, In the dark, the circulating currents of the rods and cones (arrows atbottom left) flow in the extracellular spaces of the outer nuclear layer (ONL), inner segment (IS), and outer segment (OS) layers toward the receptor outer segment tips, creating a vitreal- (and thus corneal-) positive transretinal field potential (Hagins et al., 1970) represented by the + and − symbols near the worddark. An intense ganzfeld flash of light initially completely suppresses the receptor circulating currents; the consequent collapse of their field potential generates the vitreal-negative-going a-wave, recordable in diminished magnitude but unaltered kinetics at the cornea (Hagins et al., 1970; Hood and Birch, 1995; Cideciyan and Jacobson, 1996; Smith and Lamb, 1997; Pugh et al., 1998). The suppression of their circulating currents hyperpolarizes the photoreceptors, diminishing their glutamate release at their synapses, leading to the opening of nonspecific cation channels in the dendrites of ON bipolar cells [two of which are shown spanning the inner nuclear layer (INL)]. Thus, a strong light exposure causes ON bipolar cells to generate circulating currents that flow in the inner plexiform layer (IPL) and inner nuclear layer toward cationic sinks in the outer plexiform layer (OPL); the consequent, vitreal-positive field potentials (symbolized by the + and −symbols near the word light) are now understood to underlie the b-waves (for review, see Pugh et al., 1998). The oscillatory potentials have been hypothesized to originate in a feedback circuit that involves certain amacrine cells (Wachmeister, 1998). The retinal schematic is modified from Dowling and Boycott (1966); the proper layer thicknesses of the mouse retina are seen in Figure 1.
Fig. 4.
Fig. 4.
A, Response families of cone-driven b-waves for 361 and 513 nm flashes for a GRK1 −/− mouse; each trace is the average of three to five individual responses. The 361 nm flash intensities were (from lowest to highest intensity) 740, 1400, 4300, 7200, and 13,500 photons μm−2 at the cornea (estimated to produce from 104 to 1900 photoisomerizations in the UV cones), and the 513 nm intensities were 2100, 4200, 8800, 21,500, and 90,000 photons μm−2 at the cornea (estimated to produce 360 to 15,000 photoisomerizations in the M cones). Thetopmost trace in the 361 nm column is the response to a “white” saturating flash isomerizing ∼1.2% of the “green” and 0.09% of the UV cone pigment. B, Amplitude versus intensity data for GRK1 −/− mice (filled symbols, n = 4) and Arrestin −/− mice (open symbols, n = 4) obtained with flashes of 361 nm (symbols including dots) and 513 nm (not dotted), under cone-isolation conditions, as in A. Eachsymbol represents the normalized peak amplitude of a cone-driven b-wave response (points derived from the responses illustrated in A are shown as filled orfilled + dotted circles); peak amplitudes were measured after filtering responses at 11 Hz to remove oscillations (see Materials and Methods). The peak amplitudes were normalized by dividing them by the saturating amplitude, obtained in response to the white flash (W on abscissa). The flash intensities for each animal's data were scaled by a single, common factor; this factor was the intensity at 513 nm (I513) estimated by linear interpolation to produce a response of 20% saturated amplitude (dashed line). Two saturation functions (unbroken lines), having the form rpeak/rmax = 1 − exp (−S̄λĪλ) have been plotted through the data, where Iλ is the scaled flash intensity and S̄λ is a wavelength-dependent sensitivity factor; the black curve was arranged to intercept the dashed line at the abscissa value 1.0; thegray curve is shifted left by the average relative sensitivity of cone-driven responses of WT mice to these two wavelengths, i.e., by the factorS̄UV/S̄M= 5.2 (Table 1). C, Spectral sensitivity of cone-isolated b-wave responses of GRK1 −/− (filled circles) and Arrestin −/− (open circles) compared with WT. For each GRK1 −/− and Arrestin −/− animal, the lateral shift (in logarithmic units) between the two saturation functions best fitting the 513 and 361 nm data in B was measured; the points plotted at ∼361 nm are the mean ± SD of these shifts (the open symbols have been shifted laterally for clarity). The theoretical spectra give the spectral sensitivities of the UV and M cone-driven b-wave responses of WT mice and are replotted without alteration from Figure 6 of Lyubarsky et al. (1999).
Fig. 5.
Fig. 5.
Recovery of cone-driven ERGs after a conditioning flash in WT, GRK1 −/−, and Arrestin −/− mice. White probe flashes isomerizing ∼1.2% of the M cone pigment and ∼0.09% of the UV cone pigment were delivered after a conditioning flash isomerizing ∼1% of the M and ∼0.06% of the UV pigment at ISIs specified in seconds to the left of the traces. Responses obtained without immediately preceding conditioning flashes are marked as Control. The upward pointing arrowsfor the bottommost traces in each panel show the time of the flash (a time gap of 3–5 msec containing a flash artifact has been omitted from some traces); the downward pointing arrows on the topmost traces indicate the times when the first four test flashes were delivered for the WT and Arrestin −/− mice.A, Recovery in WT mouse. The control record was obtained with an orange (λ > 530 nm) steady background that produced ∼6000 photoisomerizations rod−1sec−1, suppressing rod signals (Lyubarsky et al., 1999); for all other recordings, rod activity was suppressed with the conditioning flash. Each trace is the average of 10 records. B, Recovery in GRK1 −/− mouse; eachtrace is the average of five measurements. C, Recovery in Arrestin −/− mouse; each trace is the average of 15 records.
Fig. 6.
Fig. 6.
Recovery of the a-wave component of the mouse ERG under cone isolation conditions for WT, GRK1 −/−, and Arrestin −/− mice. The format of presentation is the same as in Figure 5, except that the time base and amplitude scales have been expanded to reveal the initial 25 msec of the records. In each panel, the portion of the traces identified with the suppression of the cone circulating current has been emphasized bythickening of the trace. The traces of the WT and Arrestin −/− mice are the same as those shown in Figure 5; the data of the GRK1 −/− mouse were taken from a different animal than those of Figure 5B, obtained in an experiment engineered to minimize the flash artifact. Nonetheless, for the larger artifact, the slowed recovery of the cone a-wave of the GRK1 −/− mouse can also be seen in Figure 5B. (In this and in other figures, a 3.5 msec segment of the recorded traceimmediately after the flash trigger has been excised; this segment contains the flash artifact, which is caused largely by a difficult-to-eliminate magnetic interference effect.)
Fig. 7.
Fig. 7.
Time course of recovery of cone b-waves and cone a-waves from the conditioning flash. A, Normalized amplitudes of cone-driven b-waves for WT (open symbols, n = 5) , Arrestin −/− (gray-filled symbols, n = 4) , and GRK1 −/− mice (filled symbols, n = 5) plotted as function of the time (interstimulus interval) between the conditioning and probe flashes. B, Normalized amplitudes of cone a-waves plotted versus the interstimulus interval. The points extracted from the experiment of Figure 6 are plotted as circles in each case. All data were obtained with the experimental protocol illustrated in Figures 5 and 6; the same symbols are used inA and B for the data of the same animal. The curves plotted through the cone a-wave data have the form amax(t)/amax(∞) = 1/[1 + exp (−(t − t0)/τ], where amax is the saturated cone a-wave amplitude, and t0 = 0.3 sec and τ = 0.15 sec for the WT and Arrestin −/− data, and t0 = 19 sec and τ = 6.2 sec for the GRK1 −/− data; these curves are equivalent in form to that used by Thomas and Lamb (1999) to characterize the recovery of the human rod a-wave after a bleaching exposure. The normalization in each panel was based on the amplitude of the responses at ISIs of 2 or 3 sec for WT and Arrestin −/− and at 300 sec for GRK1 −/−. Note that the time axis is in logarithmic units.

References

    1. Baylor DA, Lamb TD, Yau K-W. The membrane current of single rod outer segments. J Physiol (Lond) 1979;288:589–611. - PMC - PubMed
    1. Banin E, Cideciyan AV, Aleman TS, Petters RM, Wong F, Milam AH, Jacobson SG. Retinal rod photoreceptor-specific gene mutation perturbs cone pathway development. Neuron. 1999;23:549–557. - PubMed
    1. Calderone JB, Jacobs GH. Regional variations in the relative sensitivity to UV light in the mouse retina. Vis Neurosci. 1995;12:463–468. - PubMed
    1. Carter-Dawson LD, LaVail MM. Rods and cones in the mouse retina. I. Structural analysis using light and electron microscopy. J Comp Neurol. 1979;188:245–262. - PubMed
    1. Chen CK, Burns ME, Spencer M, Niemi GA, Chen J, Hurley JB, Baylor DA, Simon MI. Abnormal photoresponses and light-induced apoptosis in rods lacking rhodopsin kinase. Proc Natl Acad Sci USA. 1999;96:3718–3722. - PMC - PubMed

Publication types