. 2000 Mar 15;20(6):2255-65.
doi: 10.1523/JNEUROSCI.20-06-02255.2000.

Acute changes in maternal thyroid hormone induce rapid and transient changes in gene expression in fetal rat brain

Affiliations

Acute changes in maternal thyroid hormone induce rapid and transient changes in gene expression in fetal rat brain

A L Dowling et al. J Neurosci. .

Abstract

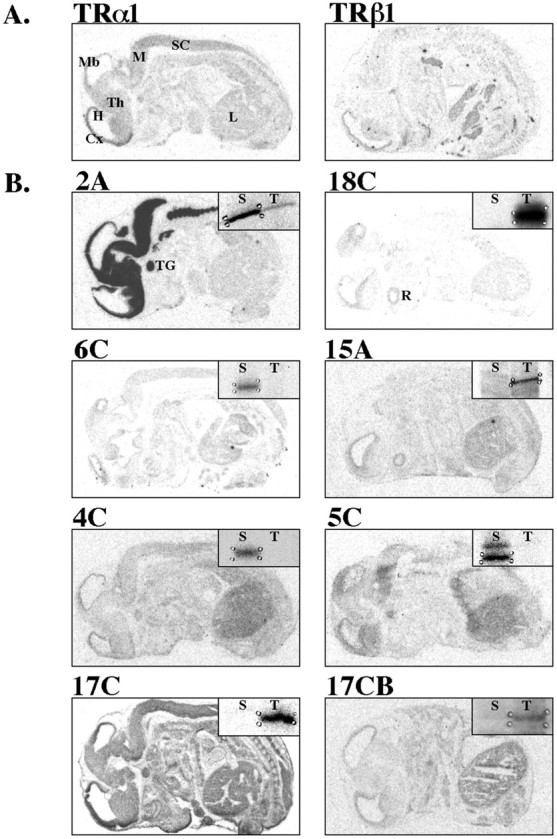
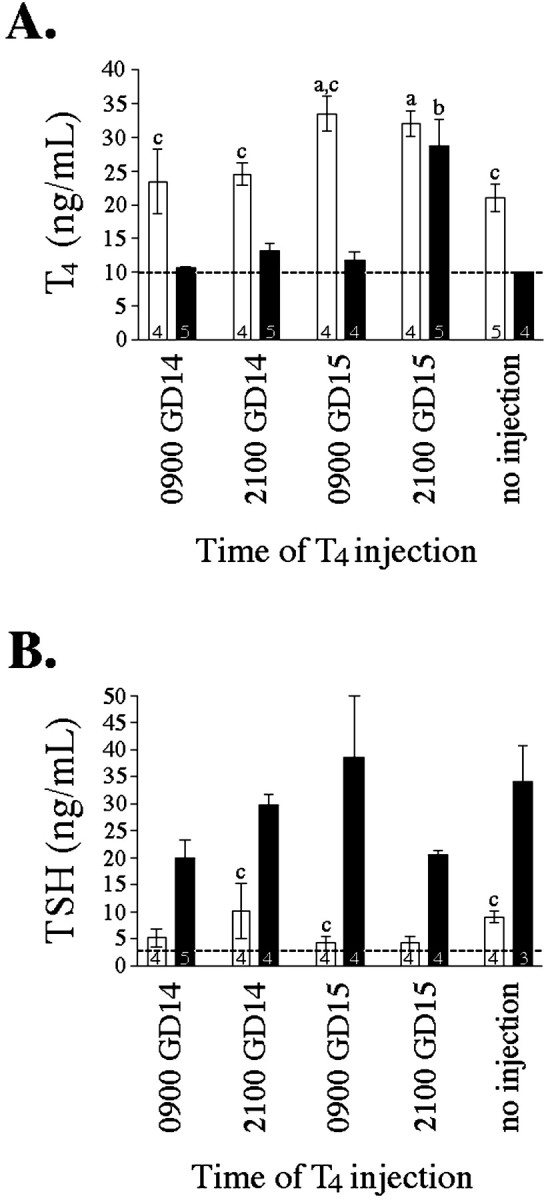
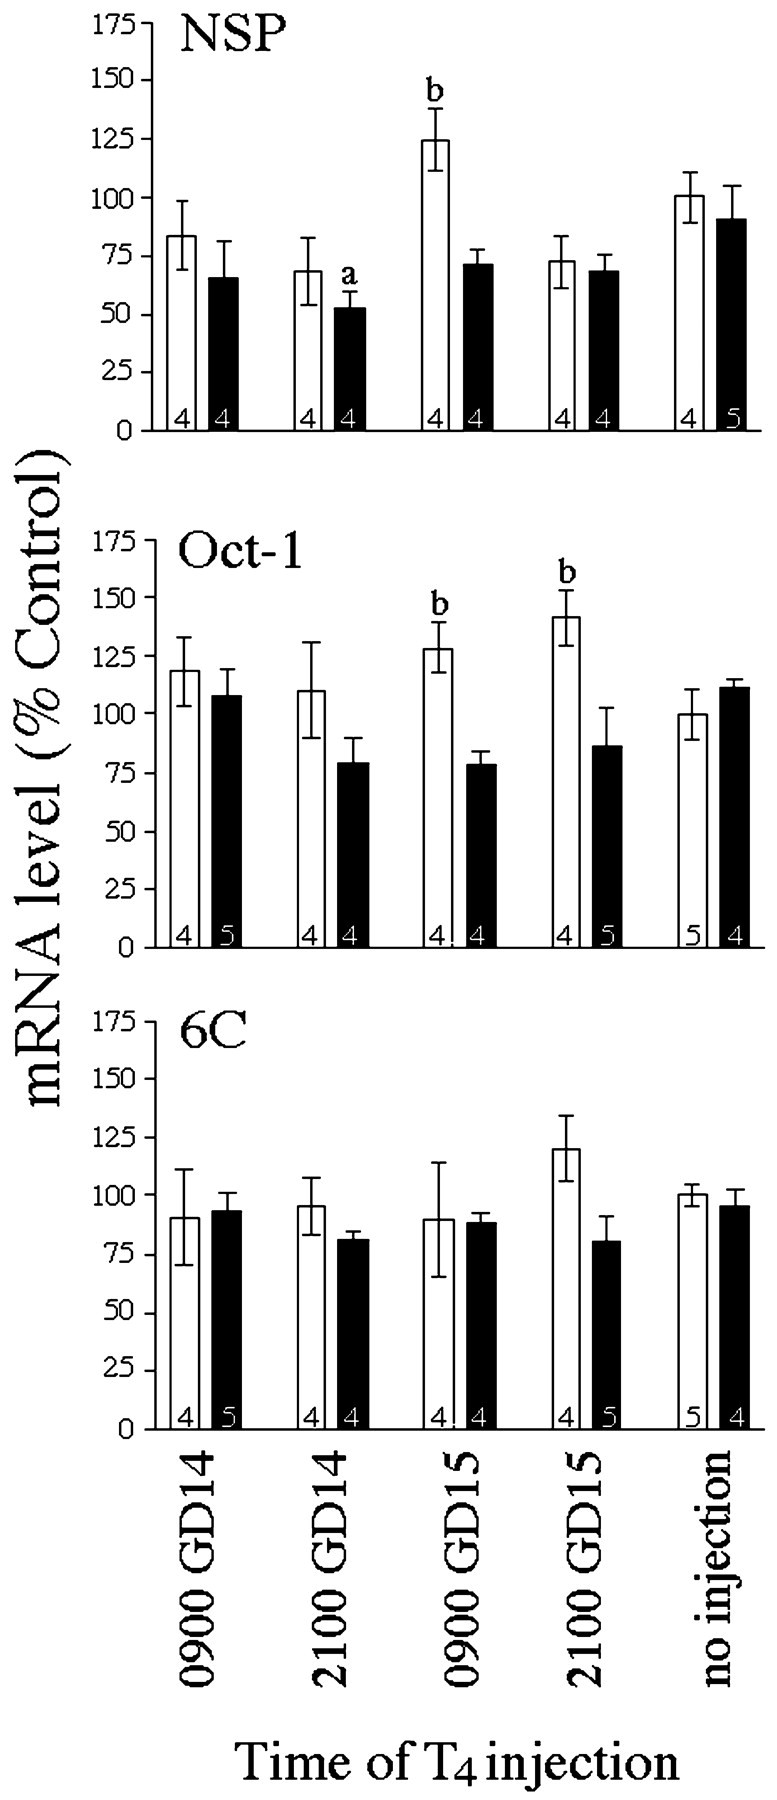
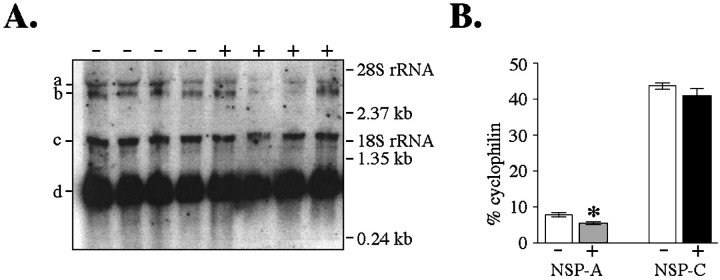
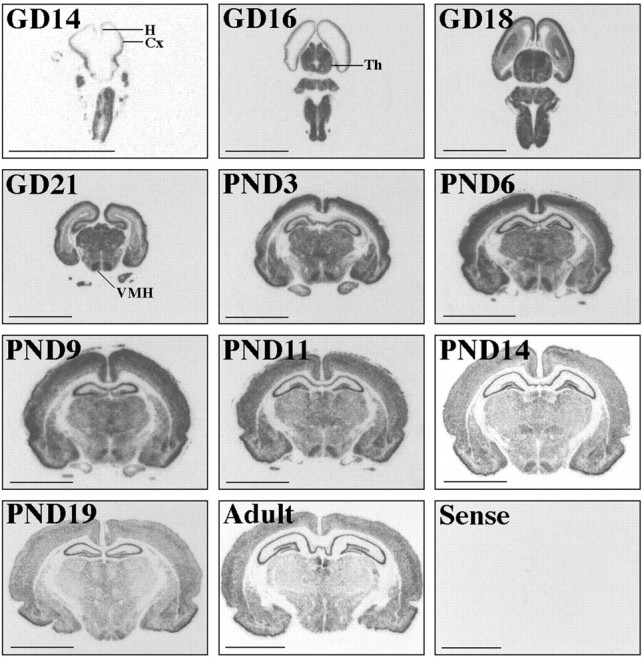
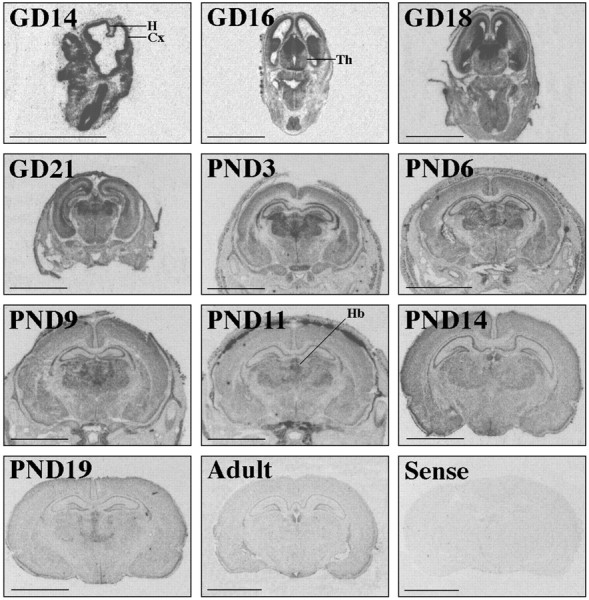
Despite clinical evidence that thyroid hormone is essential for brain development before birth, effects of thyroid hormone on the fetal brain have been largely unexplored. One mechanism of thyroid hormone action is regulation of gene expression, because thyroid hormone receptors (TRs) are ligand-activated transcription factors. We used differential display to identify genes affected by acute T(4) administration to the dam before the onset of fetal thyroid function. Eight of the 11 genes that we identified were selectively expressed in brain areas known to contain TRs, indicating that these genes were directly regulated by thyroid hormone. Using in situ hybridization, we confirmed that the cortical expression of both neuroendocrine-specific protein (NSP) and Oct-1 was affected by changes in maternal thyroid status. Additionally, we demonstrated that both NSP and Oct-1 were expressed in the adult brain and that their responsiveness to thyroid hormone was retained. These data are the first to identify thyroid hormone-responsive genes in the fetal brain.


Figures

Fig. 1.
Fig. 1.
Distribution of putative thyroid hormone-responsive genes in the GD16 embryo. Images are derived from film autoradiograms after in situ hybridization to determine whether putative thyroid hormone-responsive mRNAs identified by differential display RT-PCR were expressed in areas known to contain TR mRNAs (Experiment I). RNA probes were applied to sagittal sections of GD16 rat embryos. Sense controls were applied to adjacent sections and produced negligible hybridization signal (data not shown), with the exception of fragment 17C, which we did not examine further.A, Distribution of TRα1 and TRβ1 mRNA.B, Distribution of putative thyroid hormone-responsive mRNAs as noted above panel. Film autoradiograms of gene fragments identified by differential display are shown in insets, illustrating direction of thyroid hormone effects. See Table 1 for RNAimage primers used to generate each fragment. Cx, Cortex; H, hippocampus; L, liver;M, medulla; Mb, midbrain;R, retina; S, saline-injected;SC, spinal cord; T, T4-injected; TG, trigeminal ganglion;Th, thalamus. Scale bar, 0.5 cm.
Fig. 2.
Fig. 2.
Effect of MMI and T4 injections on serum levels of T4 (A) and TSH (B) in GD16 pregnant females at the time they were decapitated (Experiment II). See Materials and Methods for details of thyroid hormone manipulation. Bars represent mean ± SEM, with number of dams per group noted within each bar. All animals were killed at 9 A.M. (0900) on GD16. Groups differed in the timing of T4 injection as shown below the ordinate. Open bars, Euthyroid dams (no MMI); closed bars, hypothyroid dams (MMI). a Significantly different from euthyroid dams receiving no injection (p < 0.05). b Significantly different from hypothyroid dams receiving no injection (p < 0.05).c Significantly different from hypothyroid dams with identical timing of acute T4 treatment (p < 0.05). Note: Serum hormone levels below detection limit were assigned the value of the detection limit (indicated by dashed line) for statistical purposes.
Fig. 3.
Fig. 3.
Effect of thyroid hormone manipulation on gene expression in the GD16 fetus (Experiment II). Quantitative analysis of film autoradiograms after in situ hybridization for NSP, Oct-1, and 6C are described in Materials and Methods. Bars represent mean ± SEM of the film density (converted to % controls ± CV) over the cortex, with number of dams per group noted within each bar. All animals were killed at 9 A.M. (0900) on GD16. Groups differed in the timing of T4 injection as shown below the ordinate. Open bars, Euthyroid dams (no MMI);closed bars, hypothyroid dams (MMI).a Significantly different from hypothyroid dams receiving no injection (p < 0.05).b Significantly different from hypothyroid dams with identical timing of acute T4 treatment (p < 0.05).
Fig. 4.
Fig. 4.
Effect of thyroid hormone manipulation on the expression of NSP variants using quantitative Northern analysis (Experiment II). A, Phosphor-image of Northern blot in which 20 μg total RNA was hybridized with 32P-labeled NSP cDNA. 32P-labeled cyclophilin cDNA was hybridized simultaneously to control for loading variations. RNA was isolated from GD16 fetuses derived from hypothyroid dams receiving either no injection (−) or a single T4 injection at 9 P.M. on GD14 (+). Each sample corresponds to RNA pooled from four or five animals. Positions of the molecular weight standards and the 18S and 28S ribosomal RNAs are indicated. B, Quantification of band density shown in A using ImageQuant software. NSP-A mRNA was decreased after acute maternal T4 exposure. Bars represent mean band density ± SEM (converted to % total cyclophilin). a Transcript of 3.5 kb hybridized to NSP probe, corresponding to NSP-A. b Transcript of 3.4 kb hybridized to cyclophilin probe. c Transcript of 1.5 kb hybridized to NSP probe, corresponding to NSP-C.d Transcript of 0.9 kb hybridized to cyclophilin probe. *Significantly different from hypothyroid dams receiving no injection (p < 0.05).
Fig. 5.
Fig. 5.
Developmental profile of NSP expression in the rat. Images are derived from film autoradiograms after in situ hybridization using the NSP cRNA probe (Experiment III). Age is noted in the top left corner of each panel.Cx, Cortex; H, hippocampus;Th, thalamus; VMH, ventromedial hypothalamus. Scale bar, 0.5 cm.
Fig. 6.
Fig. 6.
Developmental profile of Oct-1 expression in the rat. Images are derived from film autoradiograms after in situ hybridization using the Oct-1 cRNA probe (Experiment III). Age is noted in the top left corner of each panel.Cx, Cortex; H, hippocampus;Th, thalamus; Hb, habenula. Scale bar, 0.5 cm.

References

    1. Altman J, Bayer SA. Atlas of prenatal rat brain development. CRC; Boca Raton, FL: 1995.
    1. Baka I, Ninkina N, Pinon L, Adu J, Davies A, Georgiev G, Buchman V. Intracellular compartmentalization of s-rex/NSP mRNAs in neurons. Mol Cell Neurosci. 1996;7:289–303. - PubMed
    1. Bernal J, Pekonen F. Ontogenesis of the nuclear 3,5,3′-triiodothyronine receptor in the human fetal brain. Endocrinology. 1984;114:677–679. - PubMed
    1. Boulder Committee. Embryonic vertebrate central nervous system: revised terminology. Anat Rec. 1970;166:257–262. - PubMed
    1. Bradley DJ, Young WS, Weinberger C. Differential expression of alpha and beta thyroid hormone receptor genes in rat brain and pituitary. Proc Natl Acad Sci USA. 1989;86:7250–7254. - PMC - PubMed

Publication types

MeSH terms

LinkOut - more resources